
EU Aid Explorer: the tool that answers your development aid questions
What are the main features?
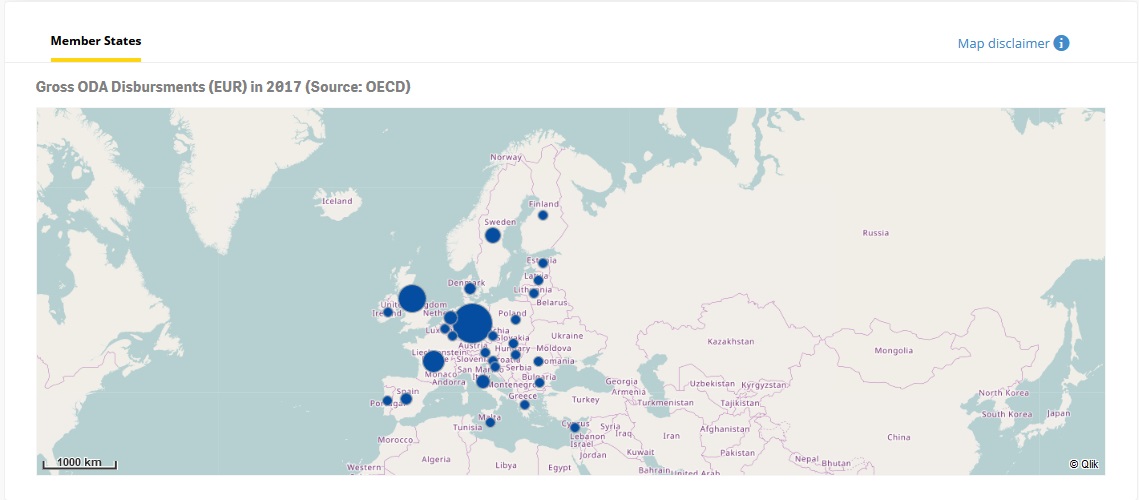
Through a dashboard, it presents development assistance data from general financial statistics all the way down to geo-localisation of projects. You can see who gives development aid, who receives it, in which sector and through which channel – and combine any of these criteria.
For example, you can easily find out how much Germany gives to Ethiopia in the 'food assistance' sector – and through which channels, for the last 10 years or so. You can then drill down to individual projects going on in the field. And that's all through just a few clicks, through maps and graphs. But its simplicity hides a very complex development process. Indeed, the database behind it has above 6 million lines!

Why was it created? Why is it important?
Frankly, because what existed before in the different databases was difficult to access! You need a PhD in econometrics just to make sense of it all. Of course, some Member States already had their own tools, but it only reflected their own data so it was quite limited. Now anyone who is interested can find what they're looking for in just a few seconds. It allows us to be fully accountable and to inform citizens.
It's also important because it shows very clearly the gaps in reporting: every flaw is revealed. That was a bit of a surprise for us! So it's an incentive for us and the Member States to publish quality data.
How was it created?
Initially, the tool was going to be developed by an external contractor. But I told Laurent, who'd just become head of the unit, we can do this together! The challenges were many. From a data point of view, it was very complex: we had to match the different databases to avoid double counting and ensure the data presented was statistically reliable. We also had to remember to keep it simple! We had to find the right compromise between the powerfulness of the EU Aid Explorer and its user friendliness.
We also had to understand each other, speak the same language, and match expectations on transparency with statistical solidity! But it went really well, and we had a small team of very inspired and competent colleagues working on it. It's a great example of breaking silos.
Finally, after an intensive 15 months of work, we had a tool which, though still imperfect, was ready to launch. The feedback we receive over the few months will help us develop an EU Aid 2.0 in a year or so.

How successful has it been since the launch?
It gained over 2,000 users from 108 countries in the first two months – and it should increase rapidly as we publicise the tool, including a presentation to IATI members. We want more colleagues to use it. We have had nothing but positive comments! We've already presented it to the Member States' directors general of development and had a standing ovation.
From the point of view of our day-to-day work, it's made finding out relevant information for briefings and presentations much simpler! In the past, when we had urgent requests from colleagues, we often had to use our contractor to fish out the data, as it could take hours and was very complex. Now we can all focus on other important tasks.
Finally, part of its success is that it's also portable – it can be used very easily on a tablet. I know my director uses it in meetings!

Interviewed expert team:
Left, Laurent Sarazin, Head of Unit for Development Financing and Effectiveness, Relations with Member States.
Right, Jérôme Le Roy, Team leader in charge of EU policies and Institutional reporting.