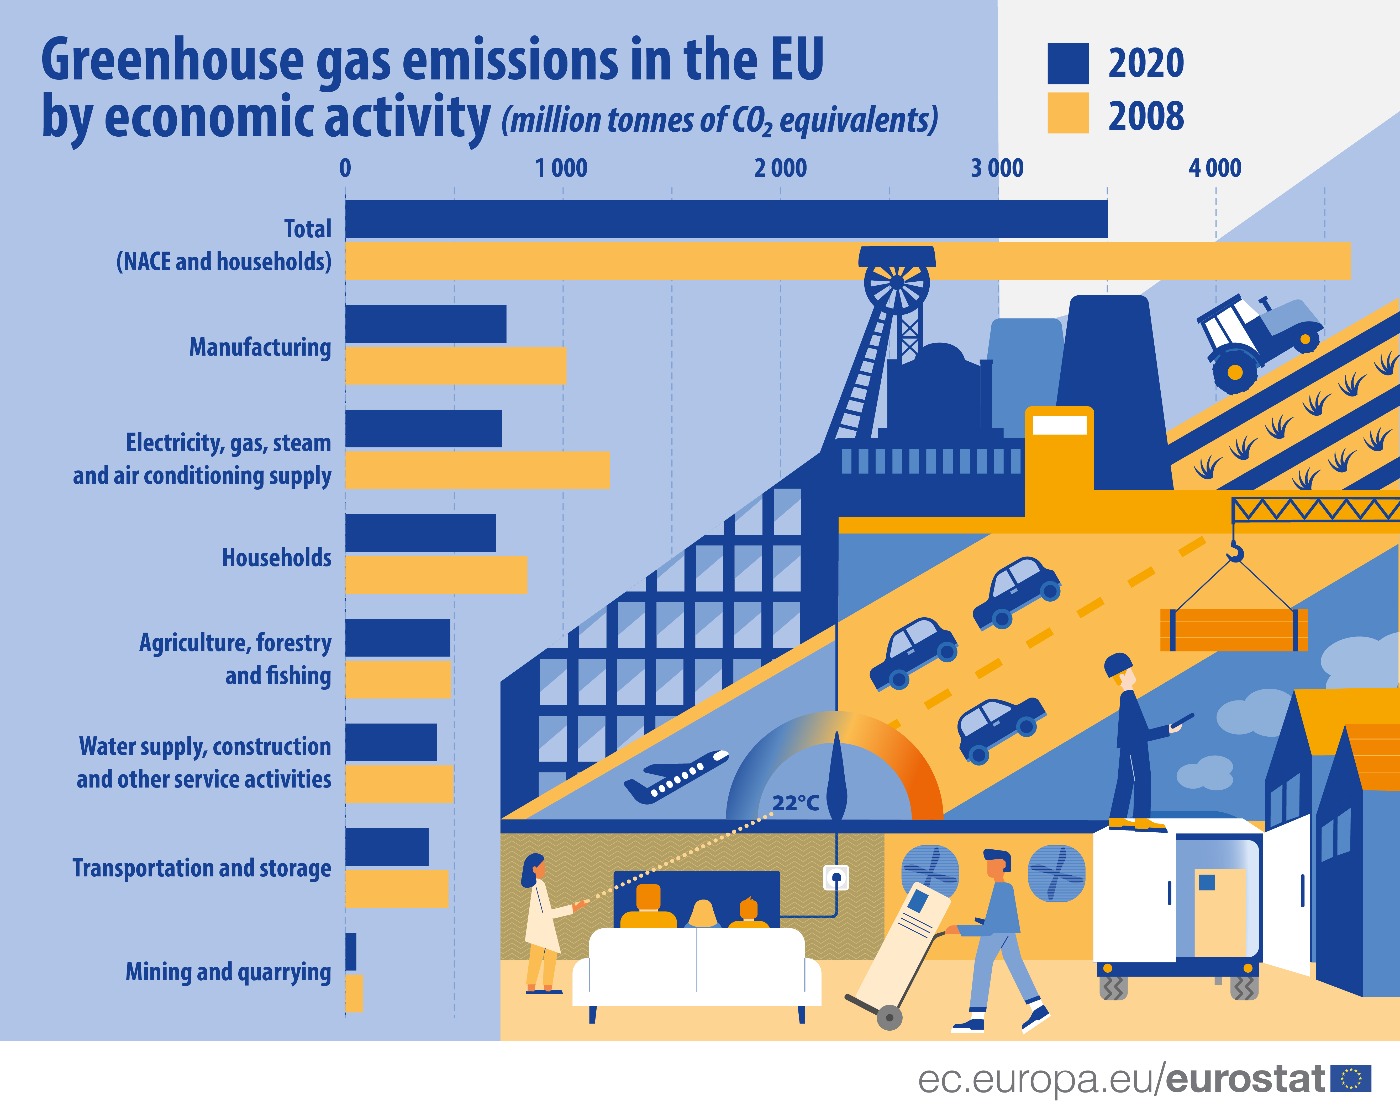
In 2020, greenhouse gas (GHG) emissions generated by economic activities of EU resident units stood at 3.5 billion tonnes of CO2 equivalents. Compared with 2019, there was a 9% decrease, and compared with 2008, there was a 24% decrease.
Annual air emissions accounts offer detailed data by 64 emitting production activities (classified by NACE Rev. 2) as well as households, as defined and classified within national accounts. For the purpose of this article, these 64 production activities have been further aggregated into 6 groups of economic activities.
The activity with the highest GHG emissions in 2020 was the manufacturing industry (740 million tonnes of CO2-eq; 21% of total greenhouse gases emitted), followed by the supply of electricity, gas, steam and air conditioning (719 million tonnes of CO2-eq; also 21%) and total activities by households (693 million tonnes of CO2-eq; 20%). Households emit greenhouse gases for transportation, heating and other purposes.
Source dataset: env_ac_ainah_r2
Between 2008 (the first available reference year) and 2020, the largest relative decrease of GHG emissions was recorded in the supply of electricity, gas, steam and air conditioning (-41%), followed by mining and quarrying (-38%) and manufacturing (-27%).
The largest absolute decrease of GHG emissions was also recorded in the supply of electricity, gas, steam and air conditioning (from 1.2 billion tonnes of CO2-eq in 2008 to 719 million tonnes of CO2-eq in 2020; -497 million tonnes of CO2-eq), followed by manufacturing (from 1 billion tonnes of CO2-eq to 740 million tonnes of CO2-eq; -276 million tonnes of CO2-eq) and households (from 836 million tonnes of CO2-eq to 693 million tonnes of CO2-eq; -143 million tonnes of CO2-eq).
For more information:
- Greenhouse gases cause climate change. The so-called ‘Kyoto basket’ of greenhouse gases includes carbon dioxide (CO2), methane (CH4), nitrous oxide (N2O) and fluorinated gases. They are expressed in a common unit, CO2-equivalents.
- Eurostat Statistics Explained article on greenhouse gas emission statistics - air emissions accounts
- Eurostat dedicated section on air emissions
- Eurostat dedicated section on environment
- Eurostat database on environment
To contact us, please visit our User Support page.
For press queries, please contact our Media Support.


