
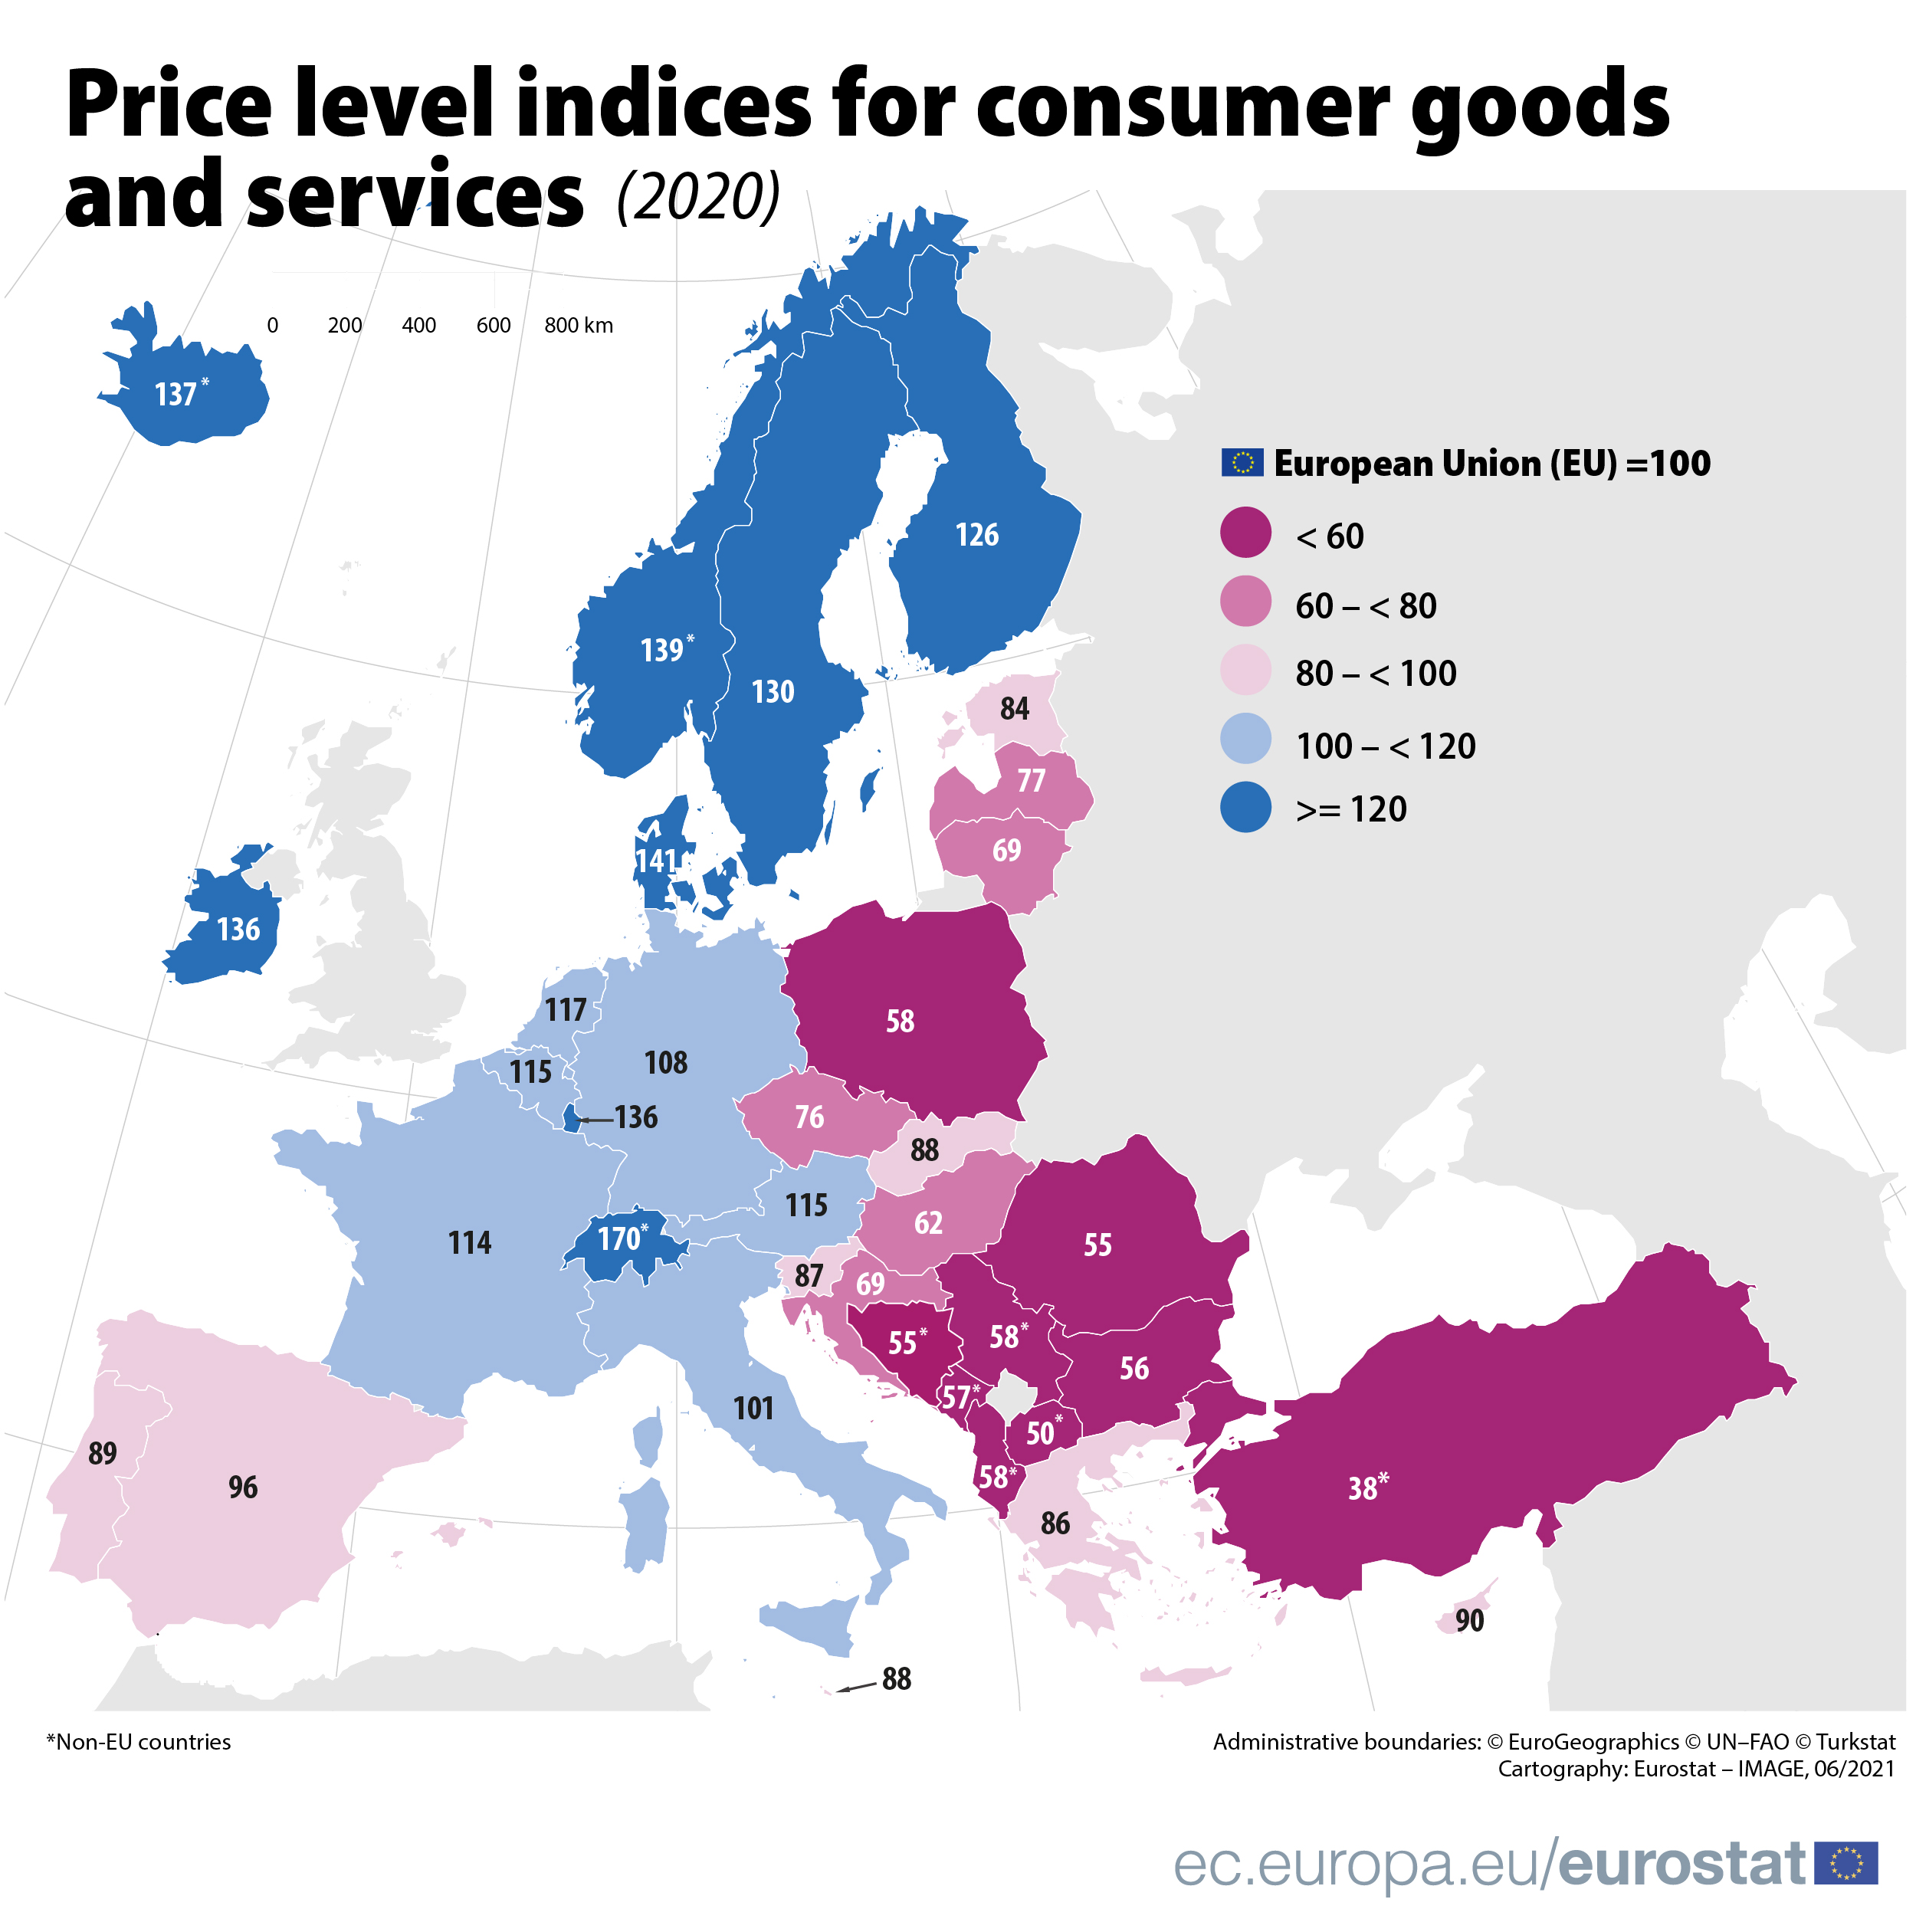
In 2020, price levels for consumer goods and services differed widely across the EU Member States.
Denmark (141% of the EU average) had the highest price level, followed by Ireland and Luxembourg (both 136%), Sweden (130%) and Finland (126%), while the lowest price levels were found in Romania (55%), Bulgaria (56%) and Poland (58%). Overall, price levels for consumer goods and services in the EU varied by almost one to three between the cheapest and the most expensive Member State.
This information comes from data on price levels for consumer goods and services published by Eurostat. The article presents a handful of findings from the more detailed Statistics Explained article.
Source dataset: prc_ppp_ind
Widest gap for restaurants & hotels and for alcohol & tobacco
In 2020, the price level for restaurants & hotels was three times as high in the most expensive country as in the cheapest one. Price levels ranged from 46% of the EU average in Bulgaria, followed by Romania (53%) and Hungary (56%), to 154% of the average in Denmark, ahead of Sweden (138%) and Finland (131%).
Alcohol & tobacco ranked second in terms of price level difference, with the lowest price levels registered in Bulgaria (61%), Hungary (69%) and Poland (70%), and the highest in Ireland (187% of the EU average), followed at a distance by Finland (158%), Sweden (136%) and France (133%). This large price variation is mainly due to differences in taxation of these products among Member States.
Food & non-alcoholic beverages were cheapest in Romania (66% of the EU average) and Poland (68%), while they were most expensive in Denmark (129% of the average), Luxembourg (126%) and Austria (125%).
Clothing is a group of products where prices differed less among Member States, ranging from 73% of the average in Hungary to 130% in Denmark. Personal transport equipment also recorded a smaller price disparity among Member States, with Poland (80% of the EU average) cheapest and Denmark (137%) most expensive. Price differences were also limited for consumer electronics, from 87% of the average in Poland to 112% in the Netherlands and in Malta.
For more information:
- Data presented in this news article are based on the results of a price survey covering more than 2 000 consumer goods and services across Europe. The overall price levels included in this news article relate to the concept of household final consumption expenditure (HFCE). This news article covers selected subcategories of total HFCE.
- Price level indices (PLIs) provide a comparison of countries' price levels relative to the EU average and are calculated using purchasing power parities. The COVID-19 pandemic has affected the price collection for purchasing power parities (PPPs) during 2020 and the estimation of 2020 expenditures used in the calculation of the first estimates of 2020 PPPs. More information is available here.
- Eurostat Statistics Explained article on comparative price levels of consumer goods and services
- Eurostat Statistics Explained article on comparative price levels for food, beverages and tobacco
- Eurostat Statistics Explained article on comparative price levels for investment
- Eurostat website section dedicated to purchasing power parities
- Eurostat database on purchasing power parities
- Eurostat visualisation tool on consumer price levels
- Eurostat metadata on purchasing power parities
To contact us, please visit our User Support page.
For press queries, please contact our Media Support.