- European Commission
- Employment, Social Affairs and Equal Opportunities
- Employment in Europe 2010
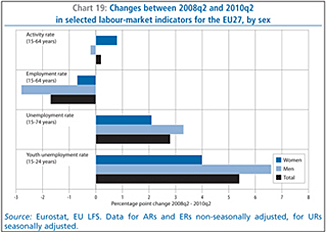
In spite of the difficult labour market conditions, at EU level the average activity rate has essentially remained unchanged since the crisis began, staying very close to the 71% level throughout the period from the second quarter of 2008 (70.9%) to the second quarter of 2010 (71.1%). This indicates that the effects of the crisis on total labour supply have been very limited to date, with no significant net withdrawal from the labour market (and if anything marginally the opposite, driven by the continued trend of increasing labour market participation by women). As a consequence, the crisis (and the subsequent employment contraction) appears not to be resulting in a noticeable reduction in overall labour market participation, neither for men nor for women, although there are a few exceptions at Member State level, but rather is focused almost entirely in its impact on unemployment (Chart 19).
The development in labour force participation in the EU contrasts with developments in the US, where during 2008 and 2009 the deterioration of the labour market was accompanied by a drop in the participation rate (by 2010q1 it was about 1.3 percentage points lower than in 2008q1). The relative stability in the EU labour force can be seen as a positive sign for prospects in the recovery, as any decline in participation during the recession could have turned into persistently lower labour supply during the recovery, hampering the functioning of the labour market through labour shortages and higher wage pressures.
Overall the European labour market has held up relatively well to the economic crisis, especially considering the reaction feared when the crisis first broke out. Although unemployment has risen, it has done so by less than might have been feared given the strength of the recession and the sharp declines in confidence. For example, despite the sharper economic downturn and stronger falls in business confidence in the EU compared with the USA, the increase in the EU unemployment rate during the crisis has been considerably less dramatic (Chart 20).
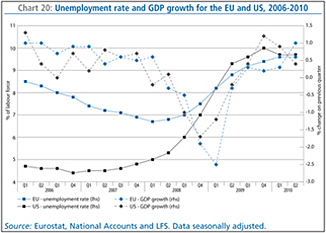
Although the unemployment rate in the EU has risen sharply since the first quarter of 2008, the increase has been much smaller than in the United States, where the rate has overtaken that of the EU despite having been much lower at the start of the crisis. By the second quarter of 2010, the unemployment rate in the EU had risen to 9.6%, up 2.9 percentage points compared to the low in the first quarter of 2008, while in the US it had increased by a more substantial 5.5 percentage points on the second quarter of 2007 (after which unemployment generally rose continuously) by the time it peaked at 10.0% in the last quarter of 2009, before falling to 9.7% in the following two quarters. Indeed, unemployment in the US more than doubled relative to the low of spring 2007, compared to an increase of around 45 % in the EU on the recent trough in spring 2008. Overall, these rises translate into an average monthly increase in the unemployment rate of 0.13 percentage points for the EU over two years, compared with a higher monthly average rise of 0.20 percentage points over around two and a half years in the US.(11)
There are several reasons which may help to explain the lower rise in unemployment in the EU compared to the US. These include the later onset of the economic downturn in the EU, the greater exposure of the US economy to sectoral shocks in the financial, real estate and construction sectors, and the stronger employment protection legislation in the EU. However, to a large extent the relative resilience of the EU labour market reflects the increased use of internal adjustment measures (short-time working, temporary suspension of production etc.) during the crisis, which allowed many EU firms to avoid reducing their workforce, especially in countries such as Germany. Although firms in both the EU and US responded to the recession by reducing the average working hours of employees, in the US this effect has been dwarfed by the much greater contribution of job shedding to the reduction in total hours worked, while in the EU proportionally more of the reduction in total hours worked occurred through reductions in the average weekly hours of employees. Indeed, while reducing staff levels was the immediate response of US firms, EU firms reacted by reducing working time instead where possible.
Nevertheless, the faster and stronger economic recovery in the US in late 2009 and early 2010, has positively affected its labour market recently. The unemployment rate in the US has possibly peaked – after reaching 10.1% in October 2009 it has subsequently fallen, dropping back to 9.5% by June 2010. Similarly, the unemployment rate in the EU has recently shown signs of stabilising, having remained unchanged at 9.6% since February 2010. The gap between the US and EU unemployment rates, as high as 0.7 percentage points in favour of the EU in October 2009, had consequently disappeared by mid-2010.
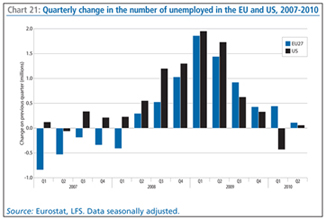
Focusing on underlying movements in levels of unemployment indicates that in both regions the increase was sharpest in the first quarter of 2009, when the number of unemployed rose by around 1.9 million in the EU as well as in the US (Chart 21). However, for the US the main period of unemployment rises occurred between 2008q3 and 2009q2, while for the EU it occurred slightly later, between 2008q4 and 2009q3. The latest developments appear to be more favourable in the US. In the first quarter of 2010, US unemployment levels fell for the first time in nearly three years. Given the fragile economic situation, however, it is too early to confirm a recovery of the US labour market, and indeed unemployment rose again slightly in the second quarter. In the EU, unemployment has continued to rise, though much more slowly than in 2009.
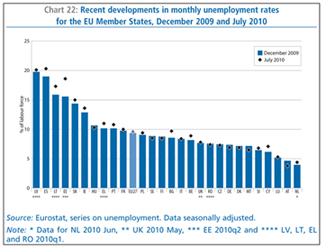
It has now been a year since the EU economy started to recover from deep recession, but it may take some time before the fragile pick-up in economic activity can reverse the trend in the labour market. Despite some signs of improvement in the general economic situation, in many countries the unemployment rate has kept increasing even over the first half of 2010, particularly in Bulgaria, Estonia, Lithuania and Spain, although in some cases a stabilization of the unemployment rate has been registered (the Czech Republic, Italy, Luxembourg, Romania and the UK) and even clear falls in several countries (Austria, Denmark, Finland, Germany, Hungary, Malta and Sweden) (Chart 22).
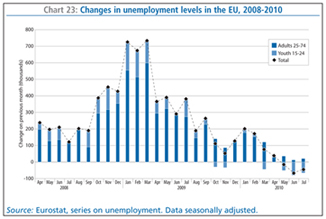
Recent data clearly show that rises in unemployment at EU level have been much more subdued since late 2009, and that the trend finally appears to be reversing (Chart 23). Unemployment in the EU may have peaked, having fallen by 127 000 since April this year, driven by falls in unemployment among young people and adult men. Signs that the particularly marked rises in youth unemployment (especially among young men) during the crisis have abated, and even started to reverse, are especially positive. Even so, total unemployment remained at a seasonally adjusted 23.1 million by July 2010, still 7.1 million higher than in March 2008, when unemployment in the EU was at a low. As a result of two years of continuously rising unemployment up until spring this year, almost one-in-ten economically active people in the EU is now unemployed.
Underlying the EU average are contrasting developments across individual Member States, both in terms of the timing of the onset of the rise in unemployment and its severity. The onset of the rise in unemployment varies considerably from country to country. Ireland, Italy and Spain were the Member States where unemployment first started to rise, as early as the first half of 2007, while in Bulgaria, Germany and Slovakia, it only bottomed out some one and a half years later in the last quarter of 2008, before subsequently heading upwards.
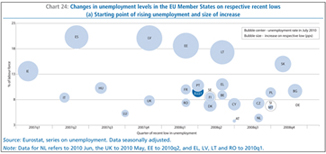
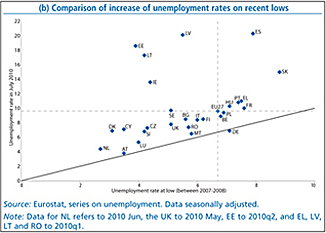
Although unemployment rates have risen in all Member States at some stage over the last two years, the severity of the increase varies considerably across countries, and does not depend solely on the time elapsed since it began to rise. The increase in unemployment has been precipitous in certain Member States (unemployment rates more than doubled since the respective onset of rising unemployment in Denmark and Spain, tripled in Ireland, and quadrupled or more in the Baltic States), while in others such as Austria, Belgium, Luxembourg, Malta and the Netherlands, and above all Germany, the rise has been relatively limited (Charts 24 (a) and (b)).
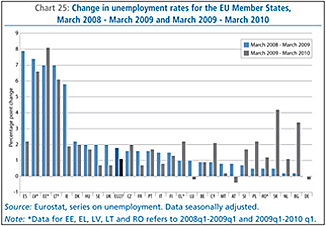
In most Member States, and for the EU as a whole, increases in unemployment in the first year after the unemployment rate first began to rise at EU level (i.e. between March 2008 and March 2009) were higher than in the subsequent year (from March 2009 to March 2010). Among those Member States most affected to date, the increase in the unemployment rate generally moderated significantly in the second year of the EU labour market downturn in Ireland and Spain (down from rises of around 6-8 percentage points in the first year to around 2 percentage points in the second) and also to some extent in Latvia and Lithuania (although remaining high), but rises were at an even higher pace in Estonia (up from 7 to 8 percentage points). Increases in the unemployment rate also weakened notably in France, Italy, Malta, Sweden and the UK, while in Austria, Germany and Luxembourg rates actually declined over the second year. In contrast, and partly reflecting the later onset of the rise in unemployment, the increases intensified markedly in the second year of the EU labour market downturn in Bulgaria, Cyprus, Greece, the Netherlands, Poland, Slovenia, Slovakia and Romania (Chart 25).
During the first year of the labour market downturn (from 2008q2 to 2009q2), most (some 62%) of the increase in unemployment at EU level was accounted for by only three Member States – Spain (36% of the rise), the UK (15.5%) and France (11%) (Chart 26). The contributions to the rise at EU level were spread somewhat more evenly across countries in the second year (from 2009q2 to 20010q2), with Spain’s share for that year dropping to 22%, France’s to 7.5% and the UK’s to 3%. In contrast, the shares for the Bulgaria, Greece, the Netherlands, Portugal, Romania, and Slovakia, and especially for Italy and Poland, increased substantially, for the latter two to around 11% and 14% respectively.
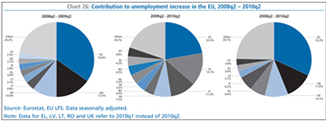
Considering the whole period since the second quarter of 2008 to the second quarter of 2010, Spain alone accounts for almost a third of the total rise in unemployment in the EU, followed by most of the other larger Member States (the UK (12%), France (10%), Poland (7%) and Italy (6%)), while the contribution of some smaller Member States has also been significant. Of note, however, is the absence of any significant contribution from the EU’s largest Member State, Germany.
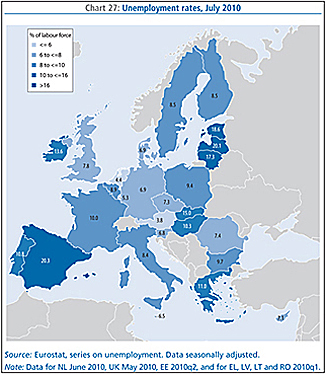
Around three years after unemployment first started to rise there, Spain (with underlying unemployment at 4.6 million by mid-2010) currently accounts for one in five of all unemployed persons in the EU, and its unemployment rate, at 20.3% in July 2010, is the highest of any Member State and more than twice as high as the EU average. The particularly pronounced rise in unemployment in Spain reflects to a large degree the role played by the low-skilled-intensive construction sector that attracted many foreign workers from abroad and was subsequently hit by a particularly strong collapse of the housing bubble in that country. Among the remaining Member States, by mid-2010 the unemployment rate was also particularly high in Latvia (20.1%) as well as in Estonia, Ireland, Lithuania and Slovakia (all with rates around 14–19%), but in contrast it remained remarkably low in Austria and the Netherlands (at 3.8% and 4.4% respectively) (Chart 27).
| (11) | Unemployment changes, rates and levels are seasonally adjusted. |