- European Commission
- Employment, Social Affairs and Equal Opportunities
- Employment in Europe 2010
Although the EU came out of recession in mid-2009, with global recovery supporting a revival in demand for EU goods and services, the economy has clearly been marked by the recent global financial and economic crisis. As a result of the financial crisis in autumn 2008, risk evasion became pervasive with much tighter credit conditions, and lending volumes to companies and individuals dropped. In addition, exposure to the substantial ongoing housing-market corrections or other country-specific factors in several Member States brought a halt to growth in domestic demand at the same time as external demand weakened. Faced with falling demand and therefore poor prospects for profits, firms sharply reduced investment. At the same time, confronted by risks to employment and the need to rebuild savings, households curtailed consumption, especially of durable items, as evidenced by the sharp declines in car sales in many EU Member States in 2009.
2.1.1. Developments in GDPFollowing solid GDP growth in previous years - 3.2% in 2006 and 3.0% in 2007 - economic activity in the EU began to decline in the second quarter of 2008 and, by the third quarter, the EU had entered a technical recession (two consecutive quarters of negative quarter-on-quarter growth). The situation deteriorated further in the following two quarters, with sharp contractions of 1.9% and 2.5% recorded, reflecting in particular marked falls in output in manufacturing and construction (Box 1). However, by the second quarter of 2009 there were signs that the recession was easing, as GDP declined by a more limited 0.3% and, by the third quarter, modest growth resumed. Economic output increased by 0.3% in the third quarter, but only rose by a mere 0.2% in the last quarter of 2009, as the impact of temporary factors started to fade. Owing to the severity of the crisis, economic output at the end of 2009 was still down by 2.2% compared to a year earlier, but at the height of the recession had contracted by as much as 5.1% year-on-year. However, stronger than expected recovery over the first half of 2010, with GDP growth of 1.0% in the second quarter, resulted in a return to positive year-on-year growth of 1.9% by the second quarter. Nevertheless, EU economic output was still down 3.3% compared to the level in the second quarter of 2008 (Chart 2)(6).
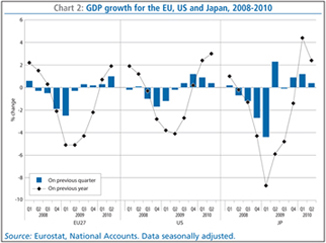
The decline in EU GDP during the crisis compares with a somewhat more limited decrease in economic output in the USA, which entered recession in the fourth quarter of 2008 and saw the drop in output peak at just over 4% year-on-year. However, the EU contraction was much less than that suffered in Japan which, due to a sharp drop in exports combined with weak domestic demand, saw economic output decline by as much as 8.7% year-on-year at its peak.
More recently, in contrast to the weak recovery in the EU over the second half of 2009, economic output in the US strengthened considerably, picking up by 0.4 % (quarter-on-quarter) during the third quarter and by a solid 1.2 % in the fourth. As a result, while by the fourth quarter output in the EU was still down by 2.2% year-on-year, in the US economic output had recovered to the levels of a year earlier. Moving into 2010, quarter-on-quarter growth in the US remained at a robust 0.9% in the first quarter but slowed to 0.4% in the second, while year-on-year growth, at 3.0% by the second quarter, remained stronger than in the EU. At the same time, the recent recovery in Japan also appears stronger than that in the EU, with output up 2.4% year-on-year in the second quarter.
Box 1: Output developments in different sectors of the business economy
Activity-based measures of the evolution of output show stark contrasts between developments in different sectors of the EU’s business economy since the crisis began (Chart 3). There has been a considerable downturn in industrial and construction output (as measured by indices of production), while the volume of retail trade has seen far less of a contraction.
The length of the downturn in EU-27 industrial production was some five quarters (declining in 2008q2 through to 2009q2), with an overall reduction of around 18% in industrial activity at the trough compared to the peak in 2008 q1. As a result, by mid-2009 industrial production had dropped back to the levels of the late 1990s. However, production posted a strong recovery over the following year and by mid-2010 industrial output was down by a relatively more limited 11.4% on the peak in 2008 q1.
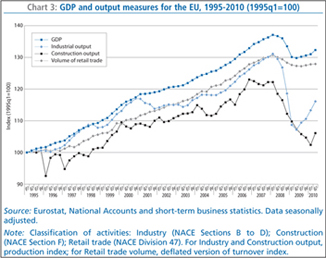
While the downturn in output as a result of the recession is most easily seen for EU industrial production, the decline in construction output was also considerable (some 16% at its trough). Furthermore, the downturn in construction activity lasted much longer (declining for eight quarters, from 2008q2 through to 2010q1) and only recently showed signs of abating as activity finally picked up in the second quarter of 2010. In contrast, the reduction in the output of the retail trade sector has been far less severe (under 3% at its trough), although, here too, there have been no clear signs yet of any strong upturn in activity.
During the crisis the main industrial groupings that suffered the largest contractions in output were the manufacture of capital goods and intermediate goods (both with output down around a quarter). For the former, the downturn likely resulted from downstream manufacturers deciding to defer investment in machinery and intermediate goods until there were signs of an upturn. There was a stark contrast in the depth of the downturn between durable and non-durable consumer goods, output for the former falling by over a fifth while for the latter it fell by only around 5%. These differences may be attributed to consumers deferring big-ticket purchases, while continuing to buy essential items, such as food. This in turn partly explains why manufacturing was more affected than retail trade, and together with the housing bubble, why the decline in construction was so strong.
| (6) | Quarter-on-quarter and year-on-year GDP growth is based on seasonally adjusted data. |