- European Commission
- Employment, Social Affairs and Equal Opportunities
- Employment in Europe 2010
The impact of the crisis across various population subgroups3. 3.3. Unemployment
Developments in employment are reflected in the recent evolution of unemployment for the various population subgroups. While the overall EU unemployment rate has risen by 2.9 percentage points since the low of spring 2008, there are significant underlying variations according to gender, age group, skill level and nationality. Nevertheless, for each group the increase was significantly higher over the first year of the labour market downturn (from the second quarter of 2008 to the second quarter of 2009) than in the second year (from the second quarter of 2009 to the second quarter of 2010) (Chart 51 and Chart 57).
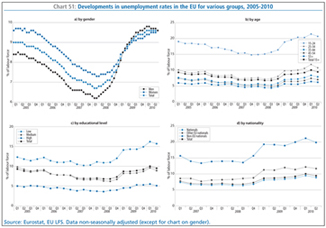
Focusing on gender, as already highlighted, the crisis has had a more dramatic effect on the labour market situation of men than that of women, and the increase in the overall unemployment rate has been driven predominantly by the rise in the rate for men, in particular in the first year of the labour market downturn (Chart 51a). Compared to when the average unemployment rate in the EU troughed in spring 2008, the rate for men had increased by 3.6 percentage points to 9.8% by February 2010, and for women by 2.3 percentage points to 9.6% by July. Consequently, the gender gap in unemployment rates, still at 1.2 percentage points to the disadvantage of women in the beginning of 2008, had switched to the disadvantage of men by spring 2009. However since autumn 2009, the lagged impact of the crisis has shifted more from men to women, and by July 2010 the male and female rates, both at 9.6%, were equal again for the first time since March 2009.
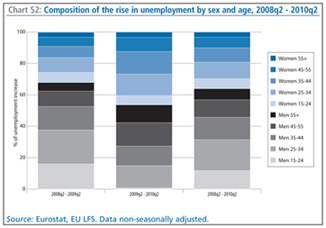
In terms of the absolute rise in unemployment in the EU from the second quarter of 2008 to the second quarter of 2010, men account for almost two thirds of the increase. Men aged 35–44, young male adults (aged 25-34) and male youth (aged 15-24) have been the worse affected during the downturn in absolute terms, together accounting for 45% of the overall increase in unemployment. However, the distribution of the total rise in unemployment differed in the two years of the downturn, shifting from younger men to older men and women. While in the first year of the downturn men aged 15-44 were affected most by rising unemployment (accounting for more than half of the total increase), in the second year men aged 45-55 and older men 55+ were hit more strongly, together with women aged 25-44, while young men were little affected (Chart 52). Overall, the rise in male unemployment has been more substantial than that for women across all age groups, being nearly double (1.6 times higher for men aged 35-54 to around twice for the older age group 55+ and for younger people aged less than 35) the rise in female employment for all groups. In terms of relative increases, the level of male unemployment jumped by 50% from the second quarter of 2008 to the second quarter of 2010, while for women the rise was more limited, amounting to around 30%. Nevertheless, it is important to qualify this gender comparison, since measures of unemployment may not necessarily capture the full impact of the changing economic conditions on women, especially as they are more likely than men to leave the labour market altogether.
Turning to developments in unemployment for different age groups, in absolute terms around a third (30%) of the rise in unemployment from the second quarter of 2008 to the second quarter of 2010 is attributable to the increase in unemployment for young adults (aged 25-34), nearly a quarter (23.5%) to adults aged 35-44, 18% to youth (aged 15-24), 18% to older adults aged 45-54 and 10% to older people aged 55 and over. As a result, unemployment rates have risen for all age groups, but particularly strongly for young people aged 15–24 (Chart 51b), for whom the rate started to rise earlier and increased particularly steeply in the first quarter of 2009, and for young adults. By the second quarter of 2010 the unemployment rate for youth had risen 5.6 percentage points relative to the second quarter of 2008 and by 3.6 percentage points for young adults, in comparison to rises of 2.5 percentage points for adults aged 35-44, and 1.8 percentage points for older adults aged 45-54 and 1.7 percentage points for older people aged 55+, thus reflecting a systematic pattern of lower increases in the unemployment rate for higher age groups.
As unemployment rates for young people were already substantially higher than those for other age groups, the strong deterioration in the labour market situation for youth during the crisis has been of increasing concern. The increase in youth unemployment at EU level has been driven by a sharp rise in the unemployment rate for young men, at least initially, which has been much more pronounced than the rise for young women. It particularly reflects a strong jump in youth unemployment in Spain, together with significant increases in France and the UK, although youth unemployment rates have also risen in all other Member States, and especially so in the Baltic States and Ireland. As a further consequence of the decrease in employment opportunities for young people, the share of young people aged 15–24 not in employment, education or training (NEETs) had increased to above 13% by the second quarter of 2010, from just above 11% in the first half of 2008, and this risks becoming a significant problem unless urgent action is taken to improve young people’s situation on the labour market (Box 4).