- European Commission
- Employment, Social Affairs and Equal Opportunities
- Employment in Europe 2010
Labour market trends during the crisis reflect two underlying phenomena: a decline in the number of persons who recently started a new job and an increase in the number who recently exited employment (i.e. who either lost or quit a job and did not enter a new one). This can be seen from EU labour force survey data, which provides data on persons who started a new job in the last three months (new hirings) and those who either quit or lost a job over the last three months and are no longer employed (newly out of employment).
Year-on-year changes in the level of new hirings show a clear downward adjustment from the second quarter of 2008 onwards, with the trough occurring in the first quarter of 2009 (Chart 13). Despite some moderation in the rate of year-on-year declines subsequently, even at the end of 2009 hirings were still down on the levels one year earlier. As a share of total employment, those employed with a new job amounted to 4.2% in the last quarter of 2009, up from the low of 3.5% in the first quarter but still well down on the average of around 5% over 2007. It was only at the start of 2010 that year-on-year changes in hirings finally turned positive again, followed by a strong pick up in the second quarter. However, this may reflect more heavily those already in employment moving to another job rather than new (re-)entrants to employment, while those employed in a new job still only accounted for a relatively limited 4.2% of total employment in the second quarter.
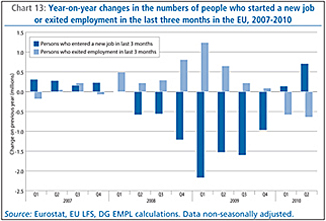
In contrast, during the crisis the numbers of those who recently exited employment rose considerably on corresponding levels a year earlier, again peaking in the first quarter of 2009 before the year-on-year changes moderated over 2009 to almost peter out in the last quarter and then turned negative in the first quarters of 2010. At around 2.0% of the employed population by 2010q2, the share of those exiting employment appears to have broadly moderated back to the pre-crisis levels observed in the years preceding 2008, having risen to as high as 3.0% at the height of the crisis in first quarter of 2009.
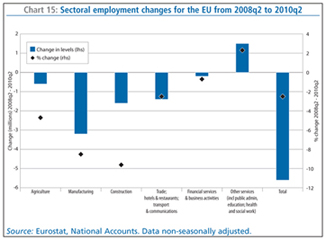
Sectoral employment and restructuringThe fall in employment levels from the second quarter of 2008 to the second quarter of 2010 resulted from a broad contraction across almost all sectors. In absolute terms job losses have been strongest in industry, where employment has fallen by 4.8 million (or 8.9%), compared to only 0.2 million (or 0.1%) in services and 0.6 million (or 4.7%) in agriculture.
At a more detailed level, the manufacturing and construction sectors have experienced the largest employment contractions, together with the combined trade/hotels & restaurants/transport & communications sector. As mentioned before, this reflects the marked drop in economic activity in these sectors as consumers deferred big-ticket purchases and the impact of the housing bubble collapse on the construction sector. All three sectors experienced broadly increasing rates of employment contraction over 2008 through to the first quarter of 2009, following which rates of contraction generally moderated though still remaining particularly high in construction and manufacturing until the second quarter of 2010 (Chart 14).
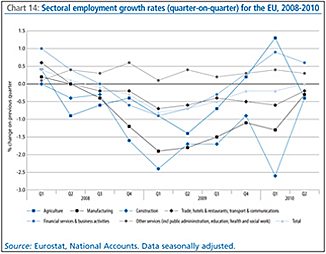
Over the latter half of 2009 and into 2010 all sectors which had previously experienced declining employment recorded an improvement (notwithstanding a sharp fall in the construction sector in the first quarter of 2010, reflecting the severe winter conditions), with substantially lower rates of employment losses, while the financial services sector has even returned to positive employment growth since the end of 2009. This suggests contraction has not shifted away from industry and construction to spread out more strongly across other sectors, but rather that all are gradually recovering. The other services sector (mainly including the public sector, education and health/social work) is the only sector which maintained positive growth during the last two years, but concerns are rising about the possibility of significant future job losses in the public sector, as many Member States face public spending cutbacks in order to reduce government deficits. Indeed the public sector is likely to play a key role in labour market developments in the near term as some governments attempt to stabilise employment through public spending while others attempt to reduce spending and public employment to balance their budgets.
Looking back over the whole period since the second quarter of 2008, total employment contraction of around 5.6 million mostly reflects significant drops of 3.2 million in manufacturing and 1.6 million in construction (equivalent to falls in sectoral employment of 8.5% and 9.6% respectively). Indeed, manufacturing on its own accounts for around 45% of all sectoral employment declines over this period, while the two sectors combined account for over two-thirds. Within services, a similarly strong contraction in the combined trade/hotels & restaurants/transport & communications sector of 1.4 million (although this equates to only 2.5% of overall employment in this sector), together with a fall of 0.2 million (or 0.7%) in the financial services/business activities sector were almost offset by employment expansion of 1.5 million (or 2.5%) in other services (Chart 15).
The impact of the crisis on manufacturing industry has been particularly severe, with a dramatic fall in output initially before recovering somewhat since the middle of 2009. The resulting impact on manufacturing employment has been substantial, although cushioned to a certain extent by overall hours worked falling even more markedly during the initial stage of the crisis, this reflecting the extensive use of short-term working in a number of industrial sectors, particularly in the automotive, engineering, basic metals, and the paper and paper products sectors.
The situation of the automotive sector is somewhat special. The sector initially faced a massive collapse in output, before the implementation at national level of scrapping schemes helped stabilize consumer demand. While anti-crisis policy measures targeted at the motor vehicle industry have alleviated the initial scale of contraction in the passenger-car segment, and helped avoid massive job losses, they risk to have brought forward sales rather than stimulate new demand. Similarly, there is a risk that the widely used short-time working schemes and labour hoarding in the automotive industry and its upstream suppliers could eventually translate into further adjustments in employment in the future.
The intermediate goods sectors, notably wood, paper and paper products, chemicals, metals, and non-metallic mineral products were also significantly affected by the crisis. Facing a severe contraction in final demand and surging uncertainty, downstream industries quickly moved to eliminate stocks of intermediate goods, resulting in some very large initial reductions in both demand and output for these sectors. However, these industries have also experienced strong cyclical adjustments in previous downturns, and are highly capital intensive. Employment has fallen by much less than output, mainly due to the extensive use of short-term working and some significant labour hoarding in the hope of a quick recovery to pre-crisis output levels.
In contrast, there are a number of sectors that are relatively non-cyclical, notably food and beverages and pharmaceuticals. The current crisis has not significantly worsened the picture in these sectors, and reductions of employment seem to have been limited. In addition, some sectors such as shipbuilding and aeronautics respond to economic cycles with a substantial time lag. For the time being, the crisis has mainly affected the order books of shipbuilders and aeronautics manufacturers, with no major impact on employment levels so far.
Finally, a number of sectors, notably textiles, clothing, leather, and furniture, had been undergoing restructuring and downsizing already before the crisis. These sectors have experienced the most severe employment adjustments, since the recent downturn has tended to reinforce the longer-term contraction of output.
These sectoral trends are broadly reflected in European Restructuring Monitor data collected by the European Monitoring Centre on Change, which gives a supporting picture of the labour market impact of the crisis at sectoral level (Box 3).
Box 3: Restructuring developments in Europe
The European Restructuring Monitor (ERM) dataset covers the employment consequences of large-scale restructuring events in Europe. Data collection is based on news and media reports of individual restructuring cases, generally involving over 100 announced job losses or gains, identified by a network of national correspondents in the EU-27 and Norway. The following provides a summary analysis of recent ERM data(1) focusing in particular on the close to 3 500 ERM case factsheets recorded during the two-year period between 2008q2 and 2010q2 – i.e. the period just before, during and after the recent severe recession. In some cases, earlier data is presented with a view to drawing out some specificities of the restructuring activity during the crisis.
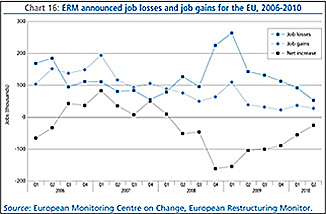
Announced job losses outnumbered job gains by a ratio of 3 to 1…After recording significantly greater announced job gains than losses for much of 2007 and the first quarter of 2008, ERM data from 2008q2 onwards demonstrates clearly the impact of the economic crisis (Chart 16). The ratio of announced job losses to new jobs created during the period was approximately 2.7:1. Total announced job losses from restructuring captured by the ERM amounted to over 1 248 000 jobs, while just over 458 000 new jobs were announced. The impacts of the crisis were most obvious in 2008q4 and 2009q1, in both of which over 200 000 job losses were announced. Since 2009q2 restructuring activity has moderated significantly though job losses continue to outnumber job gains.
Manufacturing accounted for 47% of all announced job losses in the ERM during the period 2008q2-2010q2 (Chart 17), compared to a longer-run average of 40%. The share of job losses also increased notably for the retail sector – especially during the peak quarters of the crisis in 2008q4 and 2009q1, while for the predominantly publicly-funded sectors (health, education and public administration) the shares declined compared to their long-run averages.
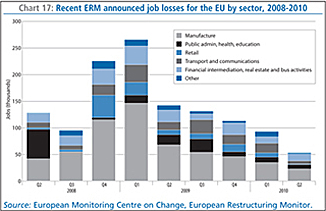
Within manufacturing, car manufacturing was the subsector that suffered the highest job losses. It accounted for nearly a quarter of total manufacturing job losses (144 000 out of 585 000) while related subsectors such as the manufacture of basic metals and of machinery/equipment also figure amongst the top job-loss subsectors. Notwithstanding its prominent role in the crisis and its aftermath, the share of restructuring job losses in financial services has remained steady thus far at around 10% of the total.
The manufacturing sector accounted for 29% of new jobs announced over the period (reduced from a longer-run average of 41%) while the retail sector was dynamic in terms of job creation as well as job loss. It accounted for a sharply increased share (24%) of job creation as large, mainly discount retailers such as Aldi, Tesco and Asda announced plans for domestic and international expansion.
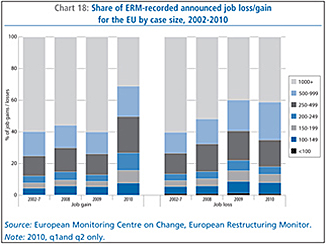
… an increased share of announced job loss cases were medium-sized (250-1000 jobs) as opposed to large cases (>1000 jobs)…Partly reflecting inherent case-size biases in the ERM, the share of announced job loss in large-scale cases involving at least 1000 job losses has varied between 40% and 60% over the period (Chart 18). The share in medium-sized cases and smaller cases increased markedly during the crisis (2008-9) before beginning to fall back in early 2010.
In terms of job gain, large scale cases involving at least 1000 new jobs account for the majority (around 60%) of overall job gains recorded in the period 2002-2009. The pattern in the first semester of 2010, as growth has resumed, has however also been quite distinctive. The share of jobs in medium-sized cases involving 150-499 jobs has doubled (from 21% to 42%).

The catch-all category of internal restructuring accounted for around two-thirds of total announced job losses in ERM restructuring cases in 2008-2009 (Table 3). Two contrasting impacts of the economic crisis have been evidenced in the share of restructuring job losses accounted for by offshoring and by bankruptcy/closure. Over 2008q2-2010q2, offshoring accounted for its lowest share of announced job losses (3%) since the ERM began while bankruptcy accounted for its highest (23%).
This is consistent with expected patterns of restructuring in a severe recession, especially one with a strong financial component. Higher levels of business failure and retrenchment occur and there is less emphasis on expansion or diversification via offshoring and relocation. From this perspective, the most recent data showing a (modest) increase in the share of offshoring may be considered a hopeful signal of recovery. Major bankruptcies were concentrated in the retail sector with Woolworths (UK, December 2008, 27 000 job losses) and Arcandor (Germany, June 2009, 5 000 job losses) emblematic of the vulnerability of even the most well-known retail groups (Table 4).

| (1) | Summary based on extraction from ERM dataset on July 5th 2010. |