- European Commission
- Employment, Social Affairs and Equal Opportunities
- Employment in Europe 2010
The sharp drop in economic activity during the crisis, combined with a much smaller fall in the number of persons employed, was ultimately reflected in the figures for the number of hours worked per person and the output generated per person employed (labour productivity). In addition to an increased share of part-time workers during the crisis, there was a significant fall in the average number of hours worked each week by people in employment (in their main job). The result of favouring reductions in working time rather than reductions in the level of employment is visible in data from the EU labour force survey on actual hours worked by those workers remaining in employment.
Over the first year of the crisis (2008q2 to 2009q2), much of the labour market adjustment took place through reductions in working hours. By the second quarter of 2009, workers in the EU worked on average 36.5 hours per week in their main job, 0.7 hours (or 1.9%) less per week than a year earlier. The decline mainly resulted from the drop in hours worked by full-time workers (by 0.7 hours to 40.3 hours), while part-time employed worked on average only 0.2 hours less. The following year (2009q2 to 2010q2) saw a slight rise in average working hours, which had increased to 36.9 hours per week by the second quarter of 2010, up by 0.3 hours (or 0.9%) on a year earlier. Nevertheless, average hours were still down by 0.4 hours (or 1%) compared to the level at the start of the crisis two years before.
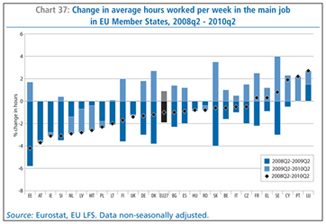
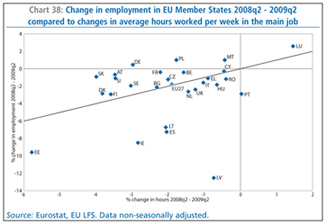
The downward adjustment in average working hours during the first year of the crisis is generally reflected at Member State level (Chart 37). In most Member States workers remaining in employment in the second quarter of 2009 worked on average less compared to a year previously, the only exceptions to this were Portugal (with no change in average hours) and Luxembourg (where average hours rose). The significant reduction in average working hours between 2008q2 and 2009q2 appears to have tempered employment contraction in some Member States, in particular in countries such as Austria, Belgium, the Czech Republic, France, Germany, Slovenia and Slovakia, but did not manage to prevent a drastic decline in employment in others such as Estonia, Ireland, Lithuania and Spain (Chart 38). Over the second year (2009q2 to 2010q2) the picture was more mixed across Member States, nevertheless with most seeing an increase in average hours worked per week, although generally less than the decline of the previous year. Average hours continued to decline significantly only in Latvia, Malta and the Netherlands. Despite the broad upward adjustment in the second year, for most Member States average hours worked in the second quarter of 2010 still remained down on the level two years before at the start of the downturn. However, in a few (Cyprus, France, Greece, Luxembourg, Portugal and Sweden) average hours were higher than in early 2008 generally thanks to the recovery over the second year.
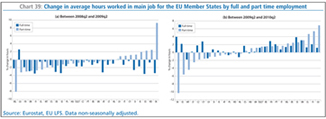
In terms of working hour developments for full-time and part-time employment, most Member States saw fairly substantial declines for both during the first year of the downturn, although in most cases the relative falls for full-time workers were more substantial (Chart 39(a)). In certain Member States, such as Estonia, Ireland, Italy, Slovenia and Slovakia, quite marked relative decreases in average hours worked by full-time workers were accompanied by noticeable increases in average hours worked by part-time workers. Part of this may be due to full time workers having their hours reduced and them subsequently being reclassified as part-time workers. Over the second year of the crisis, most Member States saw quite strong relative increases in hours worked by full-time workers, the main exceptions being Latvia, Malta and the Netherlands where significant reductions were recorded (Chart 39(b)). In general, however, any downward adjustment in the second year was mainly through reduced hours for part-time workers, this being particularly the case for most of the new Member States. (Again for some this may reflect a reclassification between part-time and full-time workers.) For most of the old Member States, average weekly working hours for both full-time and part-time workers were significantly higher in 2010q2 compared to 2009q2.
Focusing on developments across sectors, average weekly working hours shortened considerably over the initial year of the crisis across almost all sectors (Chart 40). Nevertheless, a noticeably large reduction in average weekly working time in the manufacturing sector (down 3.2% between 2008q2 and 2009q2) and in the construction sector (down 1.9%) did not prevent severe contractions in employment in these sectors of around 7% year-on-year. Similarly, despite quite large reductions in weekly working hours in transportation and storage and the wholesale and retail trade and repair of motor vehicles sectors (of 2.1% and 1.6% respectively) there was also substantial employment contraction in these sectors of close to 3%. In contrast, in several of the service sectors (most notably in Human health and social work, Education and Professional, scientific and technical activities sectors, and to a lesser extent in the Accommodation and food services and in Administrative and support service activities sectors) noticeable declines in average weekly working hours were accompanied by an expansion in employment.

In the second year since the beginning of the crisis the situation reversed, with most sectors recording rises in average working hours in 2010q2 compared to 2009q2. The strongest increases were in the manufacturing sector (up 2.2%) and in activities of households as employers (up 4.3%). In some services sectors increased working hours were accompanied by rises in employment, most notably in human health and social work, education, administrative and support service activities and activities of households as employers. However, in many sectors, especially those that had seen large employment declines in the previous year (manufacturing, construction, mining and quarrying, transportation and storage, and the wholesale and retail trade and repair of motor vehicles sectors), rises in average working hours were accompanied by further strong reductions in employment.
Labour costs and wagesOn a general level, there has been considerable wage moderation in the face of the economic downturn and the associated heightened risk of unemployment. The economic crisis has put pressure on finances and expenditures of both public employers and companies, resulting in 2008 and 2009 being years of particular pressure on workers’ wages. In the public sector this pressure has been highlighted through public wage freezes or cuts; in the private sector, through sector and company level negotiations which have often had a strong impact on wages.
Figures for year-on-year growth in compensation per employee
and
negotiated wages(17)
in the euro area show that the impact of the crisis on
wages started being reflected in late 2008 and became more pronounced
in the course of 2009
(Chart 41). Following the onset of the recession,
both measures initially continued to rise, reflecting contractual wage
agreements made in 2007-08 – a time of increasing labour
market tightness and relatively high inflation rates. This also
reflects that in some countries (such as Germany) agreements at that
time were made after a long period of wage moderation, and a period of
catching up then followed. By 2009 these trends had reversed markedly,
as the environment of weak activity, rising unemployment and low
inflation led to lower outcomes in wage negotiations.

The annual growth rate of compensation per employee started declining in the last quarter of 2008, having peaked at 3.5% in the previous quarter. It fell sharply over that last quarter and the first quarter of 2009 down to 1.7%, and then declined further over the following year, although at a much more moderate pace. It had edged further down to around 1.5% by the first quarter of 2010, before recovering slightly in the second quarter. The strong deceleration in compensation per employee over late 2008 and 2009 reflects both lower wage growth per hour and fewer hours worked.
The annual growth rate of negotiated wages in the euro area adjusted somewhat slower to the crisis, when compared to the annual growth rate of compensation per employee, reflecting that, as negotiated wages capture agreed wage increases through collective agreements, this indicator tends to react to economic changes with a lag. Growth in negotiated wages, which peaked at 3.7% in the last quarter of 2008, fell continuously over 2009 and into the first quarter of 2010, by which time it had declined to 1.8%. The decline in the annual rate of growth of negotiated wages reflected worker’s reduced bargaining power and adaptation to new market conditions as a consequence of the decline in economic activity and the increase in unemployment.
Focusing on developments at Member State level since the economic downturn in the EU began in spring 2008, year-on-year growth in wages/salaries per employee(18) to the second quarter was much weaker in most Member States in each of the last two years when compared to the average of the previous three years for the same period (Chart 42). Furthermore, wages per employee have declined in several countries over both yearly periods, notably in Ireland and the three Baltic States.
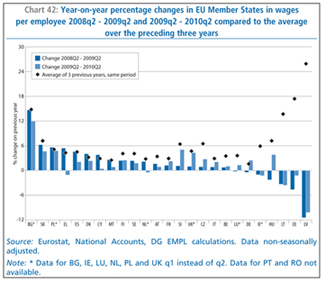
That there have also been declines in actual wages in some Member States is confirmed by official national sources. For example, according to the Latvian Statistical Office, wages in Latvia, which has been the hardest hit of all Member States by the economic crisis, had shrunk by 12% by the fourth quarter of 2009 compared to the same period in 2008. Though both public and private sectors have witnessed wage reductions, the biggest pay cuts were among government employees, who have seen their wages slashed as part of the government’s austerity plan. According to the Latvian Statistical Office, monthly average gross wages and salaries in the public sector had fallen by 23.7% compared to a year earlier, which compares with a more limited fall of 5% in the private sector.
The general moderation in growth in wages per employee in part reflects the more widespread resort to concession bargaining in response to the slump in demand during the crisis, with employers seeking to link employment security (e.g. the withdrawal of compulsory redundancy plans) to pay freezes or pay cuts. High-profile cases of this type of approach were observed in the airline industry.
In terms of developments in hourly labour costs (i.e. the
hourly labour
costs rate), after a steady acceleration in the second half of 2008,
the year-on-year growth in the EU business economy dropped sharply to
1.0% in the first quarter of 2009, before recovering to 3.6% in the
second quarter. It then fell progressively in each quarter over the
following year and by the second quarter of 2010 was down to 1.6%. The
developments in total hourly labour costs closely reflect similar
underlying developments in the wage and salary component, rises in
which decreased from a year-on-year growth rate of 4.7% in the last
quarter of 2008 to 1.5% by the second quarter of 2010 and which also
fell sharply (to 0.5%) in the first quarter of 2009
(Chart 43).
Comparing year-on-year growth in the hourly wages and salaries
component for the fourth quarter of 2009 (2.1%) with that for the same
quarter in the preceding years reveals much lower wage growth over 2009
than over both 2007 (4.0%) and 2008 (4.7%), again indicating that there
has been considerable wage moderation during the crisis.
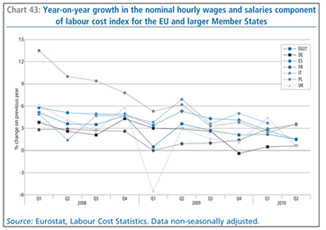
Among the larger Member States, year-on-year growth in the hourly wage rate (and consequently in hourly labour costs) declined sharply over the second half of 2009 in Germany and Poland, in the former falling to -0.4% before recovery slightly by mid-2010, and in the latter to 3.8% (compared to around 13.5% at the beginning of 2008 and 7.8% in the last quarter of 2008). Similarly, by the end of 2009 year-on-year growth rates were well down in all the other larger Member States except Italy compared to levels in the last quarter of the previous year, especially in the UK which, together with France, experienced a particularly strong fall in the first quarter of 2009. By the second quarter of 2010 year-on-year growth rates had declined further in Spain and the UK, but had recovered strongly in France.
| (17) | Compensation per employee is the total remuneration, in cash or in kind, that is payable by employers to employees, i.e. gross wages and salaries, as well as bonuses, overtime payments and employers’ social security contributions, divided by the total number of employees. The index of negotiated wages measures the direct outcome of collective bargaining in terms of basic pay (i.e. excluding bonuses) at the euro area level. It refers to the implied average change in monthly wages and salaries. |
| (18) | This is a macro-economic aggregate and negative values cannot simply be read as indicating that there have been wage cuts. The composition of the employee population may change and result in changes in wages per employee without any wage rate having changed, i.e. it also reflects the underlying changes in the distribution of employees across sectors/ occupations etc. |