While often receiving the most attention, national figures alone cannot reveal the full and sometimes complex picture of what is happening within the EU Member States. The Covid-19 pandemic has further demonstrated the importance of regional data as its impact has varied significantly by region.
Today, Eurostat releases a package of publications presenting a wide range of regional indicators:
- Eurostat regional yearbook 2022 (available in print, pdf and Statistics Explained articles)
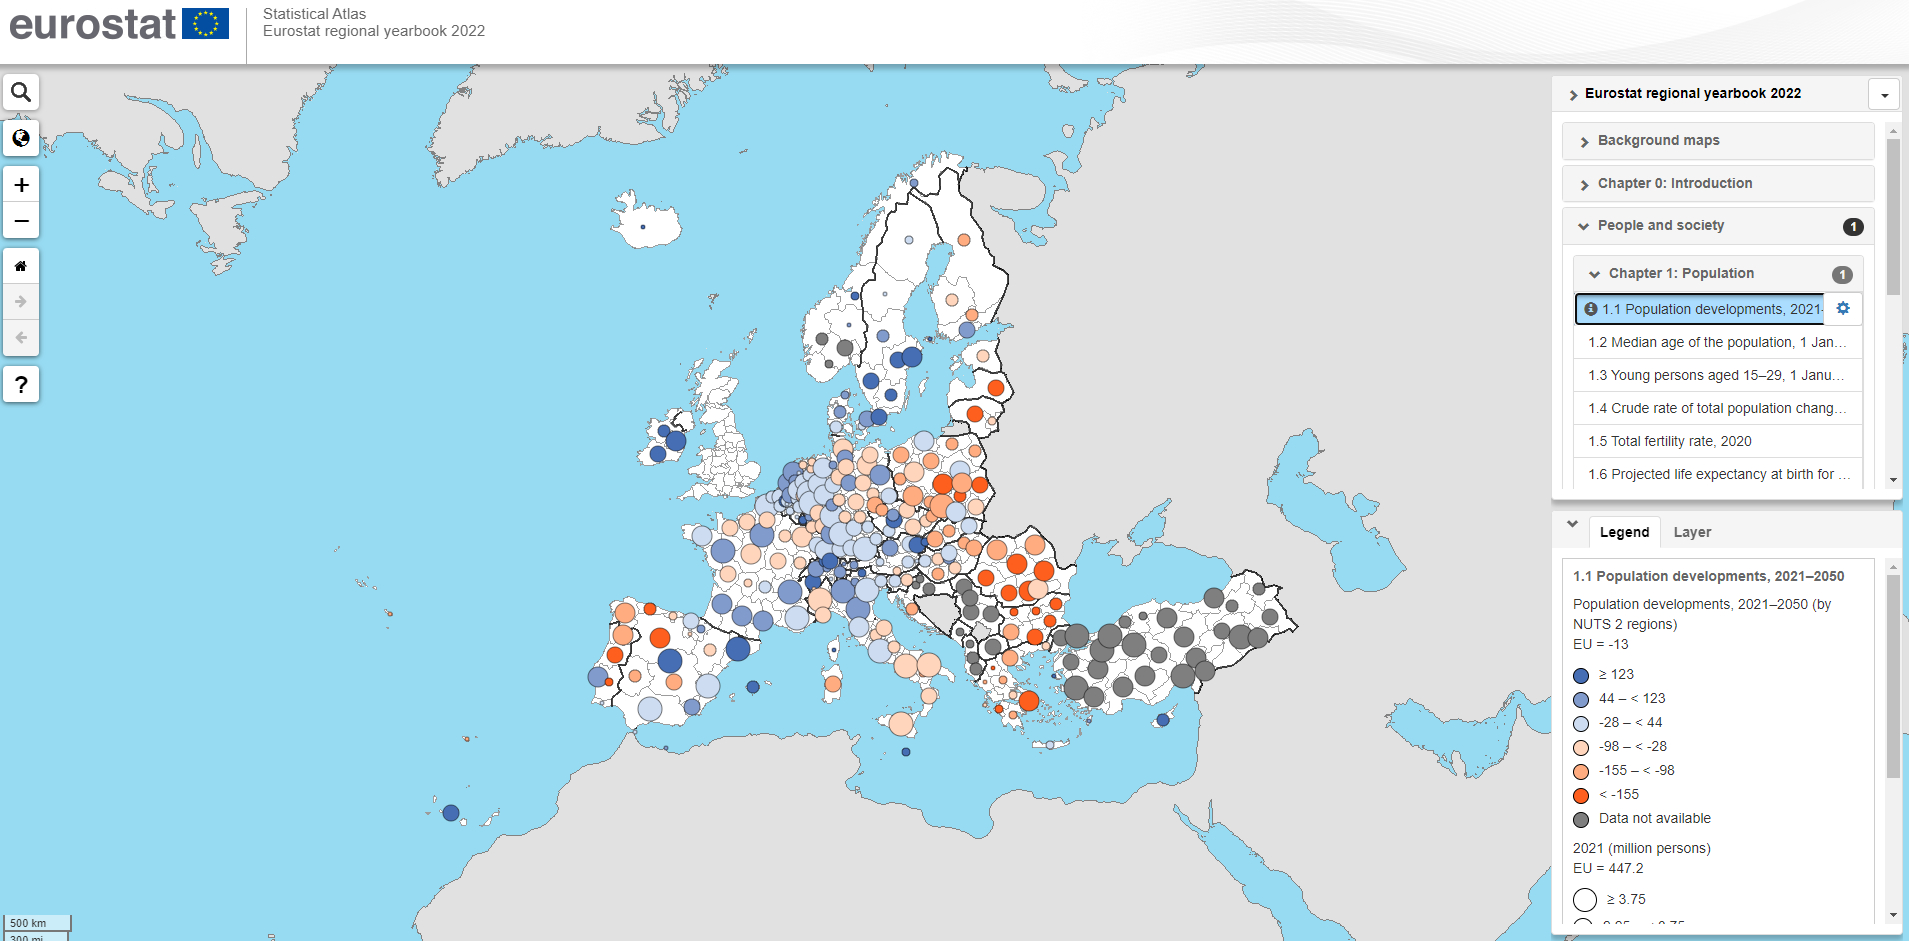
- Statistical Atlas visualisation tool 2022
- Regions in Europe - 2022 interactive edition
The 2022 edition of the Eurostat regional yearbook provides a statistical overview of the regions of the EU across a broad range of subjects: population, health, education, the labour market, living conditions, the digital society, the economy, business, research and development, tourism, transport, the environment and agriculture. The data are brought to life in maps, figures and infographics, highlighting regional variations and similarities.
This year’s publication focuses on the European year of youth 2022 initiative, the impact of the Covid-19 crisis, cancer developments and water-related issues.
From the bird’s eye view to the worm’s eye view
Do you have a favourite map from the Eurostat regional yearbook? All maps can be explored interactively using the Statistical Atlas. Visit the updated map visualisation tool and zoom in on your region to see the details.
Explore more regional data in the new interactive publication
The Regions in Europe - 2022 interactive edition offers a wide variety of dynamic visualisations with short, objective texts, which allow you to get a deeper understanding of the social, economic and environmental situation across the EU regions. Perfect for classroom use as well as for study at home.
Interested in examining regional population change over time in your region? Or maybe the differences in the level of educational attainment and the labour market? Our interactive publication crosses all this data and includes, for example, graphics on the employment rate of recent graduates.
This is just an example of the many visualisations available in the new interactive publication Regions in Europe - 2022 interactive edition.
What’s next?:
Eurostat will participate in the European Week of Regions and Cities 2022:
- On 12 October, 9:30 AM CEST, Eurostat will host the workshop ‘Facts Matter: Data stories on regional development’.
- On 13 October, 10:30 AM CEST, Eurostat will have a 15-minute Exhibitor’s Pitch, ‘Explore the statistics for your region!’.
- You can also access Eurostat’s virtual exhibition ‘Your free access to European Regional Statistics’.
For more information:
- Eurostat regional yearbook - 2022 edition, also available as a set of Statistics Explained articles, containing the underlying data
- Regions in Europe - 2022 interactive edition
- Statistical atlas visualisation tool
- Dedicated section on regions and cities
To contact us, please visit our User Support page.
For press queries, please contact our Media Support.


