

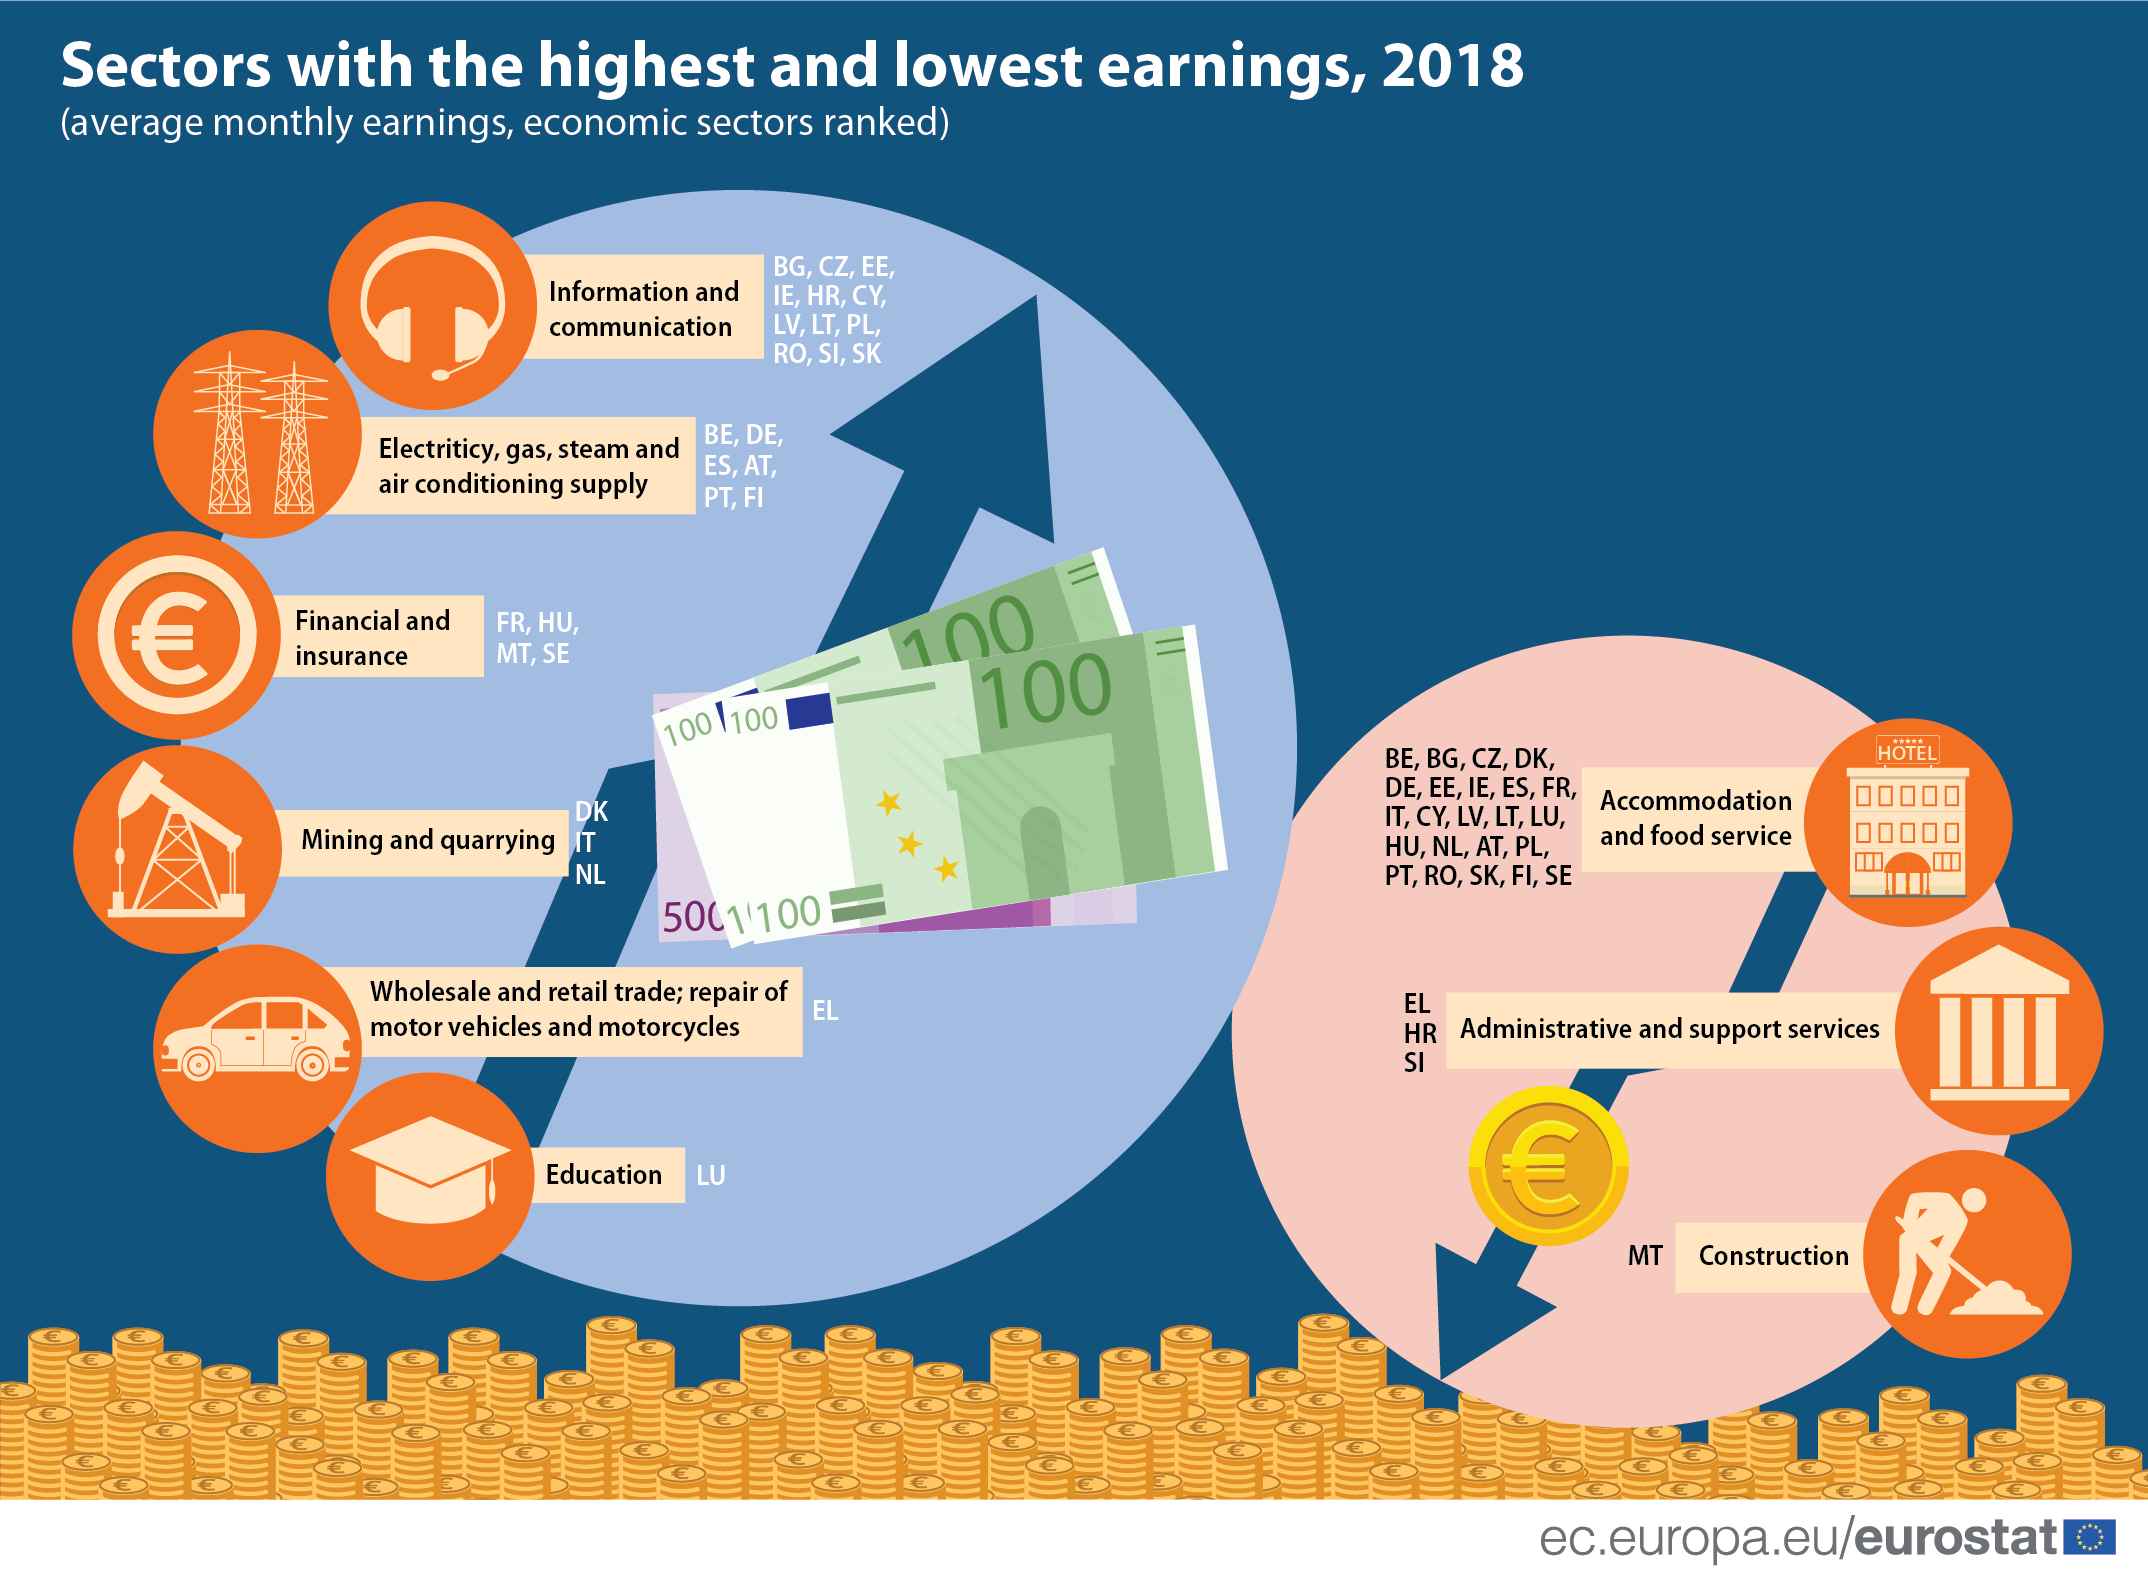
How much people earn varies considerably between economic activities. Which sectors have especially high earnings and which have low earnings may also differ between countries. Which are these high and low paying sectors, measured in average gross monthly earnings in euro?
In 2018, the 'Information and communication' industry was the highest paying sector in twelve of the 27 EU Member States, and was second in another four. The average gross monthly earnings were high also for 'Financial and insurance activities'. Although it was the highest paying sector in 'only' four Member States (France, Hungary, Malta and Sweden), it came second in sixteen and third in six Member States. Another sector with high earnings was 'Electricity, gas, steam and air conditioning supply' which was the best paying industry in six Member States and second highest in another two.
At the opposite end of the ranking, 'Accommodation and food service activities' was identified as the lowest paying industry in all Member States except Greece, Malta and Slovenia (second lowest) and Croatia (third lowest). 'Administrative and support services' ranked as the second lowest in most Member States (12 of the 27) and the lowest overall in three countries (Greece, Croatia and Slovenia).
'Education' was the best paid economic activity in Luxembourg and second best in Cyprus in 2018. While the 'Wholesale and retail trade; repair of motor vehicles and motorcycles' sector was on average the highest paid in Greece, it ranked among the industries with low earnings in most of the other Member States.
The earnings in 'Construction' ranked in midfield in most Member States, with the highest rank being the sixth highest paying sector in Poland and seventh highest in Estonia, Latvia, the Netherlands and Sweden. In contrast, the construction sector was the lowest paying in Malta in 2018, and was also among the lowest in Croatia and Romania (second lowest) as well as in Hungary, Portugal and Slovenia (third lowest).
Source dataset: EARN_SES18_20
A list of the country codes and the full names of the respective Member States can be found here.
The data presented have been collected through the Structure of earnings survey (SES), which is conducted every four years.
For more information on statistics in this area, take a look at the overview of earnings statistics and the Statistics explained article Earnings statistics.
Note:
- Gross monthly earnings refer to wages and salaries earned by employees in the reference month (generally October 2018), before deduction of tax and social security contributions. Overtime pay, shift premiums, allowances, bonuses, commission, etc., are included. The gross monthly earnings of part-time employees have been converted into full-time units.
To contact us, please visit our User Support page.
For press queries, please contact our Media Support.