

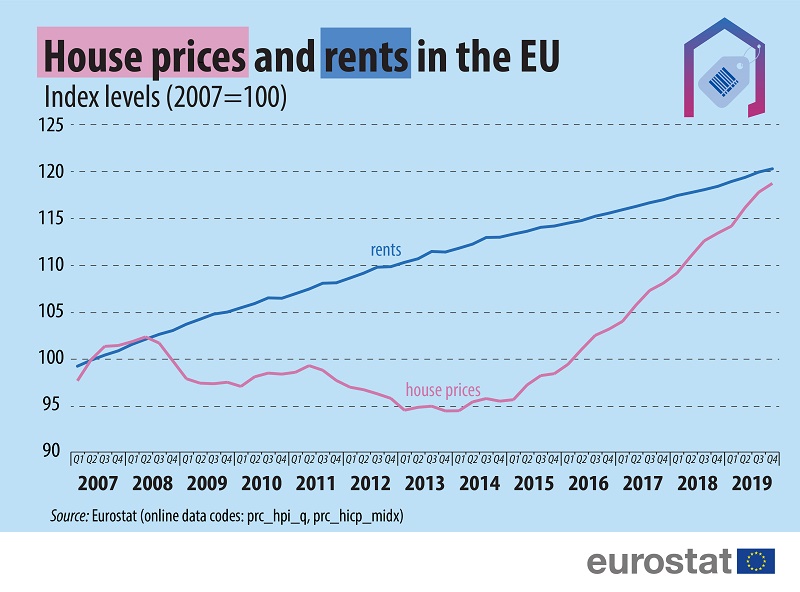
House prices and rents in the EU27 have followed very different paths since 2007. While rents increased steadily throughout the period up to the fourth quarter of 2019, house prices have fluctuated significantly.
After an initial sharp decline following the financial crisis, house prices remained more or less stable between 2009 and 2014. Then there was a rapid rise in early 2015, since when house prices have increased at a much faster pace than rents.
Over the period 2007 until the fourth quarter of 2019, rents increased by 20.3% and house prices by 18.7%.
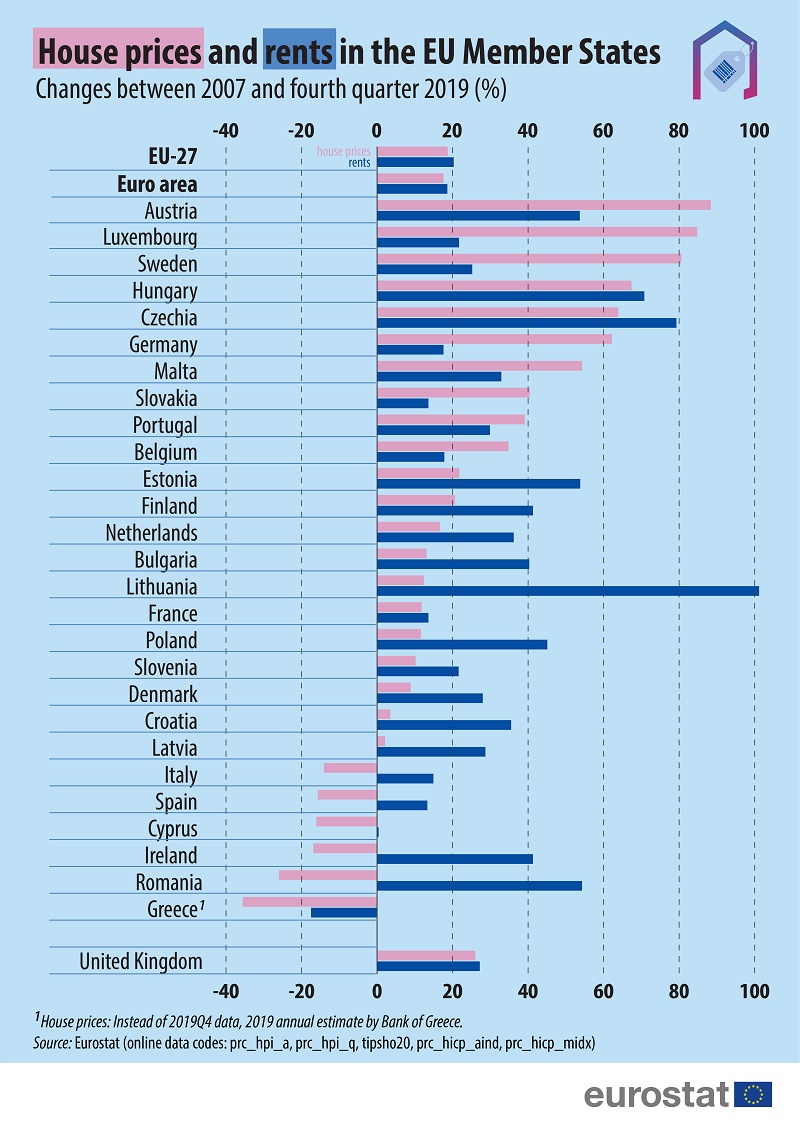
When comparing the fourth quarter of 2019 with 2007, house prices increased in 21 EU Member States and decreased in 6, with the highest rises in Austria (+88.4%), Luxembourg (+84.8%) and Sweden (+80.6%) and the largest decreases in Greece* (-35.6%), Romania (-26.0%) and Ireland (-16.9%).
For rents, the pattern was different. When comparing the fourth quarter of 2019 with 2007, prices increased in 26 EU Member States and decreased in one, with the highest rises in Lithuania (+101.2%), Czechia (+79.3%) and Hungary (+70.8%) and the only decrease in Greece (-17.5%).
* Instead of fourth quarter of 2019, 2019 annual estimate by Bank of Greece
For further information, see the Statistics Explained article Housing price statistics - house price index.
To contact us, please visit our User Support page.
For press queries, please contact our Media Support.