Correction coefficients - Civil servants remuneration
Correction coefficients are percentages applied to remuneration of expatriate officials to adjust for differences in price level of consumer goods and services in the duty station (Intra-EU or Extra-EU) by reference to base city (Brussels).

Methodology
For Intra-EU duty stations, average prices are taken from the annual surveys conducted under the European Comparison Programme to establish multilateral purchasing power parities for national accounts purposes under the 2007 PPP Regulation. These prices are used to establish bilateral parities with Brussels for Article 64 purposes. The rolling cycle of surveys covers the full basket of consumer goods and services in three years and then repeats. In between surveys of the same type, prices are updated using detailed indices. Specific additional annual price data collections are done for estate agency rents, education (school fees) and hospital care. Periodic surveys of household consumption expenditure are coordinated amongst expatriate international officials. An anonymised recent version of the ECP product list is available at
For Extra-EU duty stations, average prices are taken from the non-EU countries participating in the European Comparison Programme (9 coordinated by Eurostat and 7 coordinated by OECD), and from the annual surveys conducted by the United Nations International Civil Service Commission (these cover 200 duty stations at least once during a cycle of five years). This work is done in accordance with an International Memorandum of Understanding signed in 2009. Over time, the Extra-EU item definitions have been increasingly harmonised with the Intra-EU ones.
Introduction
- Correction coefficients take into consideration cost-of-living differences in diverse duty stations compared to Brussels and Luxembourg and integrate them into the remuneration of EU staff.
- Eurostat has a long experience in compiling, producing and disseminating official statistics on cost-of-living differences. While a number of other public and private sector organisations publish cost-of- living indices and rankings, the figures produced by Eurostat rely on larger observation samples, greater experience in data collection and a well-developed methodology.
- These statistics are regularly, directly applied to adjust the remuneration of over 400,000 individuals (EU staff in representations, delegations and agencies, participants in EU programmes and staff of international organisations). Through collaboration with the United Nations International Civil Service Commission (ICSC) and the Coordinated Organisations International Section for Remuneration and Prices (ISRP), they are also known to be used by more than 40 national administrations and many other international organisations for the benefit of their expatriate personnel around the world.
What is a correction coefficient?
- A correction coefficient is applied to the remuneration of staff members at a given place of employment in order to make up for differences in living conditions, as compared to Brussels and Luxembourg. In order to evaluate such differences in living conditions, the EU Staff Regulations use differences in purchasing power as a statistically reliable and calculable indicator.
- The objective of correction coefficients is to ensure that purchasing power in a given place of employment follows the same evolution as in Brussels and Luxembourg. Correction coefficients do not aim at maintaining purchasing power in a duty station at a certain level over time. For instance, when the purchasing power of staff in Brussels and Luxembourg decreases (e.g. because of a freeze of nominal salaries in those places as in 2013 and 2014), the purchasing power of staff in London or Rome decreases in the same proportion.
Why do we need correction coefficients?
- The correction coefficient puts into practice the general principle of equal treatment, which in this case corresponds to the equality of purchasing power between all staff of the EU institutions regardless of their place of employment.
- Changes in correction coefficients must be distinguished from the updates of the basic salary grid which apply to all EU staff and embody the principle of ‘parallelism’ between the evolution of purchasing power of EU civil servants and national civil servants in the Member States.
- Correction coefficients only apply to staff serving in posts outside Brussels or Luxembourg who should not have to suffer financially because of higher living costs in their duty stations. Similarly, if the cost of living at a particular duty station is lower than in Brussels and Luxembourg, staff should not gain an unfair advantage.
- Hence, the correction coefficient operates as a percentage adjustment to the salary to compensate the difference (positive or negative) in the cost of living in each duty station as compared with Brussels and Luxembourg.
How are correction coefficients applied in practice?
- An official's remuneration expressed in euros, after the compulsory deductions, is weighted by a correction coefficient above, below or equal to 100, according to the formula in the previous section.
- For Eurozone countries the correction coefficient is therefore the average price ratio (or economic parity) expressed as a percentage.
- For the countries outside the euro zone, an exchange rate must be used to express the average price ratio (or economic parity) as a percentage in local currency. The same rate is used to convert the salary from euros into local currency. That rate is fixed annually on 1st July in accordance with Article 63 of the Staff Regulations. It is the exchange rate used for the implementation of the general budget of the EU.
- As the correction coefficient is defined as the economic parity divided by the remuneration exchange rate (multiplied by 100), if the local currency appreciates relative to euro, the correction coefficient will increase (other things being equal); thus local purchasing power will remain the same, as well as the salary in local currency.
- Example 1 (euro countries): Suppose that the average basket of goods and services costs 240 euros in your duty station and 200 euros in Brussels. The price ratio (or economic parity) is therefore 240/200 = 1.2. That means that you would need a 1200 euros salary to have the same purchasing power as with a 1000 euros salary in Brussels. In other words, to maintain your purchasing power in the duty station you would need a 20% higher salary than in Brussels. A correction coefficient of 120 is applied to your salary expressed in euros, to guarantee the same purchasing power.
- Example 2 (non-euro countries): Suppose that the average basket of goods and services costs 600 local currency units (LCU) in your duty station and 200 euros in Brussels. The price ratio (or economic parity) is therefore 600/200 = 3.0. That means that you would need a 3000 LCU salary to have the same purchasing power as with a 1000 euros salary in Brussels. If the fixed exchange rate applied to your remuneration was 2.5 LCU/euro, a correction coefficient of 120 (=100 X 3.0/2.5) would be applied to your salary expressed in euro to bring the salary up to 3.000 (=1000 X 120/100 x 2.5). If the exchange rate was 2.4 LCU per Euro, the correction coefficient would have to be 125 (=100 x 3.0/2.4) to bring the salary up to 3.000 (=1000 X 125/100 x 2.5). As you can see, the value of the exchange rate modifies the correction coefficient without affecting your purchasing power in the duty station or your net salary in LCU.
How are correction coefficients calculated and updated?
Purchasing power parities : The establishment of correction coefficients requires comparing relative living costs between the main places of employment and the places where staff are on duty. The technique is to compare the price of the average ‘basket’ of goods and services purchased by staff in Brussels with the price of the average basket purchased by staff in each of the other places of employment.
- Based on the classification foreseen under the ‘European Comparison Programme’ that is the main framework for the production of statistics at EU level, the full range of goods and services is divided into 80 groups, called ‘Basic Headings’ (such as footwear, local public transport, bread and cereals, tobacco etc.). The overall list of goods and services used for calculating correction coefficients, which is regularly discussed and agreed with the national statistical institutes, contains more than 3000 items.
- In order to follow closely the pricing of these items, national statistical institutes in co-operation with Eurostat carry out a number of price surveys in all duty stations, spread over a 3-year period with two surveys per year covering each one a broad category. Between each duty station and Brussels a parity is obtained for each of the 80 ‘Basic Headings’.
- The system is designed to take into account the differences in consumption patterns between every duty station. Indeed, EU staff adapt to local circumstances; they take advantage of lower prices and alternative products where appropriate, while preserving home pattern to some extent.
- In practice, it means that the calculation of a global economic parity requires the aggregation of the 80 elementary parities using specific consumption weights expressed as percentages of total expenditure, according to their relative importance in the consumption baskets for Brussels and for all the duty stations. For this purpose, every five to seven years Eurostat carries out a Survey of Household Expenditure in the different duty stations among the staff serving at that time; the average result is established as the consumption pattern of the duty station until the next survey.
- For housing, which is the largest single item of expenditure for many people, a specific methodology has been set up and constantly improved over time by Eurostat with the national statistical institutes. Rent parities are based on market rents obtained from special surveys of estate agencies. The scope of these surveys is to compare the average market rent for some specific kinds of dwellings in some pre-specified representative areas of Brussels with similar dwellings in similar (representative and comparable) areas in other EU capitals and duty stations.
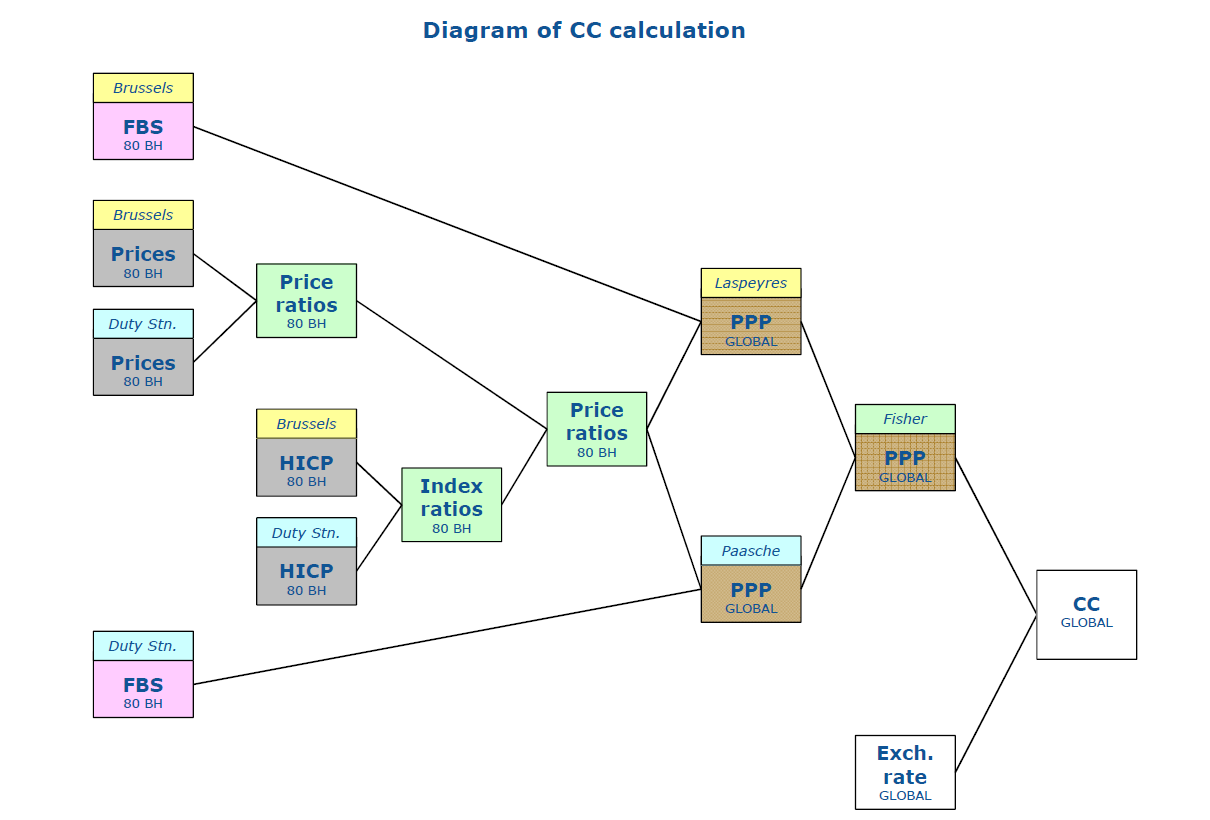
- The following diagram (extracted from Eurostat methodology) illustrates the successive steps in calculating global parity.
- The annual process of correction coefficient updates : The annual process for updating correction coefficients encompasses a number of stages, from data collection by Eurostat and the national statistical institutes, to the consultation process led by the Commission DG HR and the publication of the update in the Official Journal of the EU.
- In March each year Eurostat convenes a meeting of the Working Group on Article 64 and 65 of the Staff Regulations, composed of experts of the national statistical institutes of all Member States:
- The statistical methodology is discussed and national statistical institutes are required to provide the necessary basic data for the calculation of the update by the end of September.
- The Staff Regulations require each basic parity to be checked by direct survey at least once every five years. In practice checks are carried out at shorter intervals as part of the European Comparison Programme. At each annual salary review around one third of the basic price parities are replaced by new parities produced by the latest price survey.
- The 80 basic parities are then updated using the price index ratio between the place of employment and Brussels. For this purpose Eurostat uses the Harmonised Indices of Consumer Prices (HICP). These indices are those produced and published monthly with the co-operation of Member States for use in all fields of EU policies. They have a common reference base, a common classification and are considered by the Commission and the European Central Bank as the best measures of international comparison of consumer price inflation.
- In accordance with the Staff Regulations, the HICP for Member States is compared with the Joint Index for Brussels and Luxembourg. This is to ensure that the purchasing power follows the same evolution patterns in all places of employment as in Brussels and Luxembourg.
- Before the end of October, Eurostat issues a report on changes in the cost of living in Belgium and Luxembourg, economic parities and changes in the purchasing power of salaries in national civil services in central government.
- Upon reception of the Eurostat report, in order to ensure that all stakeholders are properly informed and have an opportunity to check Eurostat figures beforehand, the Commission Directorate-General for Human Resources carries out a number of consultations at various levels:
- Staff representatives are consulted at expert level in the GTR (‘Groupe Technique Rémunération’). Several agencies' staff representatives are members of this group. The Staff Committee is also informed.
- Within the Commission, all concerned services, including the Legal Service, the General-Secretariat, PMO and DG BUDG are consulted. The College of Commissioners takes note of an information point on the update.
- On the basis of this consolidated data, the Commission prepares a report on the budgetary impact of the update. It is transmitted to the European Parliament and the Council.
- The update is also discussed in the Comité Préparatoire des Questions Statutaires where institutions' and agencies' administrations are represented.
- The Commission publishes the updated amounts and correction coefficients within two weeks after the update in the C series of the Official Journal of the European Union for information purposes. In parallel, all institutions and agencies are informed.
- Safeguards provided by the Staff Regulations: At the end of the year-long process described above, the annual update normally takes place in December. However, the Staff Regulations foresee a number of safeguards to ensure that the correction coefficient system fits as much as possible with the reality of cost-of-life evolution:
- To be in line with the reference date on which economic parities and exchange rates are set, the annual update takes retroactive effect on 1st July. This retroactive effect, due to the combination of the update of all statutory amounts and the update of the relevant correction coefficient, can be either negative or positive depending on the agent's personal situation. If that retroactive update necessitates the recovery of sums overpaid, such recovery may be spread over a period of not more than 12 months.
- To account for substantial changes in the cost of living during the period between two annual updates, an intermediate update takes place at the end of the spring with retroactive effect on 1st January, only in duty stations where the change in the cost of living has exceeded 3%. Such intermediate updates are subject to a consultation process similar to the one managed by the Commission DG HR for the annual update. In practice, due to the synergies between the economies of the Member States, only a very limited number of places of employment are concerned every year (in 2015, only the correction coefficients for Greece and Cyprus are updated).
- In places where the cost of living increases substantially, the date on which the intermediate or the annual update takes retroactive effect is set before 1st January or 1st July to reduce the potential loss in purchasing power.
Diagram of correction coefficient calculation and update (Click on picture to enlarge it)
Legal considerations
- The roots of the system of correction coefficients: From the early days of the institutions, in order to avoid difficult annual salary negotiations and lengthy strikes, staff requested the creation of a method for salary update.
- The first method for salary update, adopted by the Council in 1972, already included a system of correction coefficients. Its main principles – parallelism, equality, transparency, objectivity – have been established by the case-law.
- As regards correction coefficients, the case-law established that EU staff should enjoy equal purchasing power regardless of their place of employment. It has confirmed that Eurostat enjoy a large margin of appreciation in the determination of the methodology to appreciate equality of purchasing power.
- The 2014 reform: The 2014 Reform has reintroduced a method for the annual and intermediate updates of salaries, pensions and correction coefficients. This method is laid down in Article 64, Article 65 and Annex XI of the Staff Regulations. It covers a 10-year period running until December 2023, and will continue indefinitely thereafter unless modified following an evaluation in 2022.
- The main change in the new method lies in the automaticity of the update. While in the past every adjustment required the adoption of a Council regulation, the updates are now effective without intervention of another legal act. This is an essential guarantee for EU staff as it will avoid the long-lasting inter-institutional disputes that we encountered in the recent years.
- In exchange for the automaticity of the update, and to provide for increased savings in the current economic context, the Member States introduced a two-year freeze of salaries and pensions in 2013 and 2014. It is worth noticing that this freeze of nominal salaries in Brussels and Luxembourg, which resulted in a loss of purchasing power, had to be compensated by the correction coefficients in other places of employment. This is why correction coefficients were still regularly updated during the ‘freeze’ period, giving rise to a loss of purchasing power equivalent to the one experienced by staff in Brussels and Luxembourg.
