European Statistical Recovery Dashboard: June edition

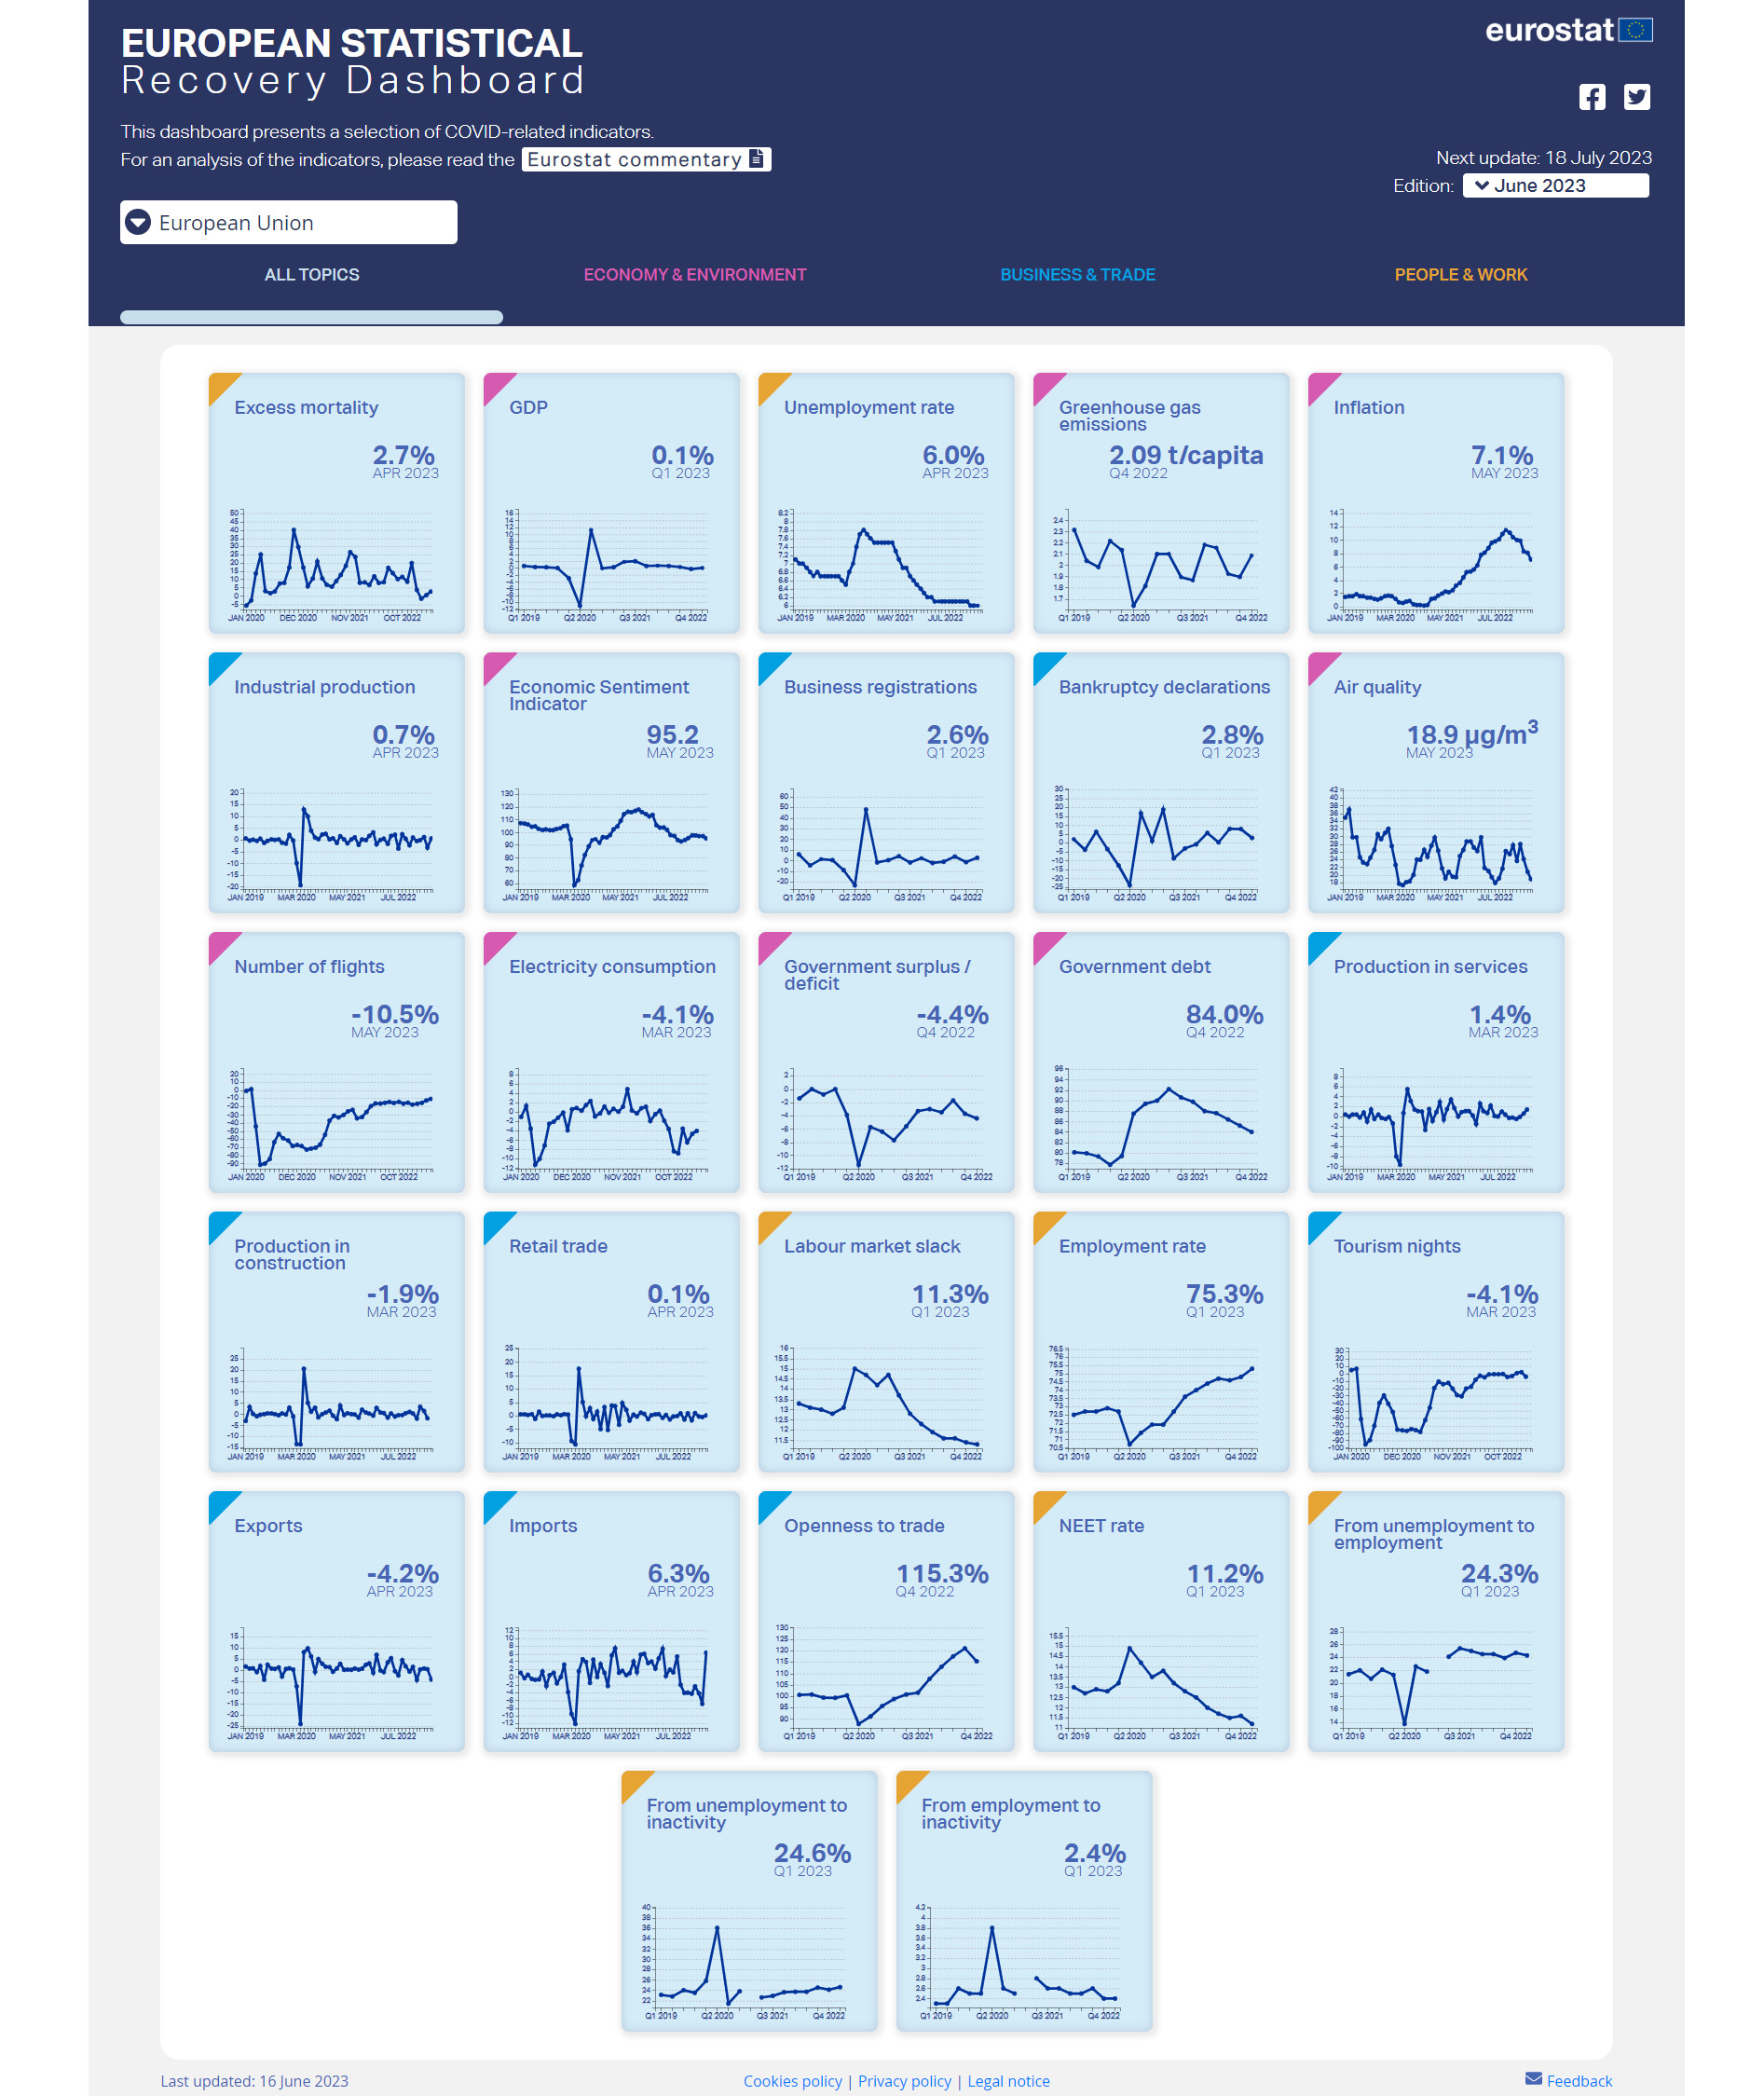
Today, Eurostat released the June edition of the interactive European Statistical Recovery Dashboard.
The dashboard contains monthly and quarterly indicators from a number of statistical areas relevant to tracking the economic and social recovery from the COVID-19 pandemic, across countries and time.
June highlights: After the EU economy returns to growth, industrial production increases and inflation continues to fall
After a modest return to growth in Q1 2023, the EU economy experienced positive developments in industrial production and retail trade, with both sectors showing increases in April. However, the overall GDP recovery trend has flattened, and the revival of industrial production and retail trade shows a fluctuating pattern, though both remain above pre-pandemic levels. Additionally, the retail trade sector exhibits a downward trend, likely influenced by factors such as high inflation that have affected consumer spending. Furthermore, while the comprehensive view of the services sector is limited to data available until March, it is worth highlighting that the sector recorded a second consecutive month of growth in March 2023, continuing to significantly outperform pre-pandemic levels.
In May 2023, EU economic sentiment weakens, marking a further decline from its last peak observed in January. This decline adds to the period, started in April 2022, in which DG ECFIN's Economic Sentiment Indicator (ESI) has remained below its pre-pandemic level.
The EU inflation rate fell for the seventh straight month in April 2023, and the unemployment rate remained stable in April at historically low levels, contributing to brightening the economic landscape in the EU. The excess mortality rate increased for the second month in a row in April 2023 at the EU level, although remaining relatively low.
You can read the full analysis by clicking “Eurostat commentary” on the dashboard’s header. The dashboard is updated every month with the latest available data for each indicator.
The line charts in the dashboard offer many functionalities to easily explore and analyse the development of the indicators, such as displaying a longer time series, comparing several countries and downloading the customised chart or the source dataset.
For more information
- Statistics Explained article on Eurostatistics - data for short-term economic analysis
- Thematic section on COVID-19
- Thematic section on Sustainable Development Goals (SDGs)
If you have any queries, please visit our contact us page.

