
Since the start of the millennium, the EU’s resource productivity has increased by around 35%, despite a slight decrease in 2020. Resource productivity quantifies the relationship between the size of the economy and the use of natural resources. The value of resource productivity increases when the economy, measured by GDP, grows at a faster rate than the consumption of raw materials, measured by domestic material consumption (DMC).
After a period of moderate growth in the early 2000s, resource productivity increased sharply during the financial and economic crisis of 2008-2009, resulting from pronounced falls in domestic material consumption. The crisis affected the material-intensive industries of manufacturing and construction more than the rest of the economy.
Then, following several years of steady growth, resource productivity slightly decreased in 2020. This was largely due to a significant decrease in GDP due to the COVID pandemic, while domestic material consumption decreased moderately (for more information) as the consumption of construction material and biomass remained stable.
This information comes from data on material flows and resource productivity recently published by Eurostat. The article presents a handful of findings from the more detailed Statistics Explained articles on material flow accounts and resource productivity, resource productivity statistics and physical imports and exports.
Source datasets: env_ac_rp (resource productivity), env_ac_mfa (DMC) and nama_10_gdp (GDP)
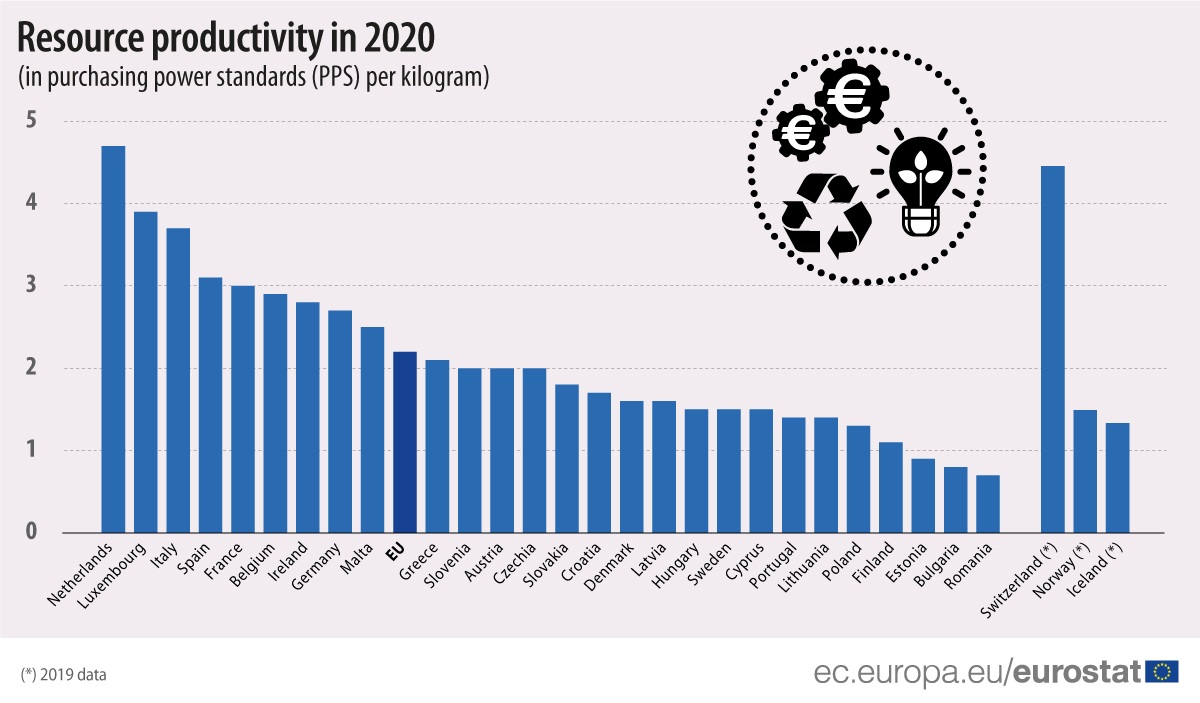
Resource productivity highest in the Netherlands, lowest in Romania and Bulgaria
The level of resource productivity varies widely between the EU Member States: from less than €0.4/kg in Romania and Bulgaria to €5.4/kg in the Netherlands in 2020.
After accounting for price differences, the Netherlands remains the EU Member States with the highest resource productivity (4.7 purchasing power standards (PPS) per kg), followed at a distance by Luxembourg (3.9) and Italy (3.7).
At the opposite end of the scale, three EU Member States registered resource productivity below 1.00: Romania (0.7 PPS/kg), Bulgaria (0.8) and Estonia (0.9).
Source dataset: env_ac_rp
These differences can be explained by a country's natural resources, the diversity of its industrial activities, the role played by its services sector and its construction activities, the scale and patterns of its consumption and its various energy sources.
For more information:
- Eurostat Statistics Explained articles on resource productivity statistics, material flow accounts and resource productivity and physical imports and exports
- Eurostat What’s new article on domestic material consumption
- Eurostat website section dedicated to material flows and resource productivity
- Eurostat metadata on material flow accounts
- Energy Union and Climate priority of the European Commission
To contact us, please visit our User Support page.
For press queries, please contact our Media Support.