Reference metadata describe statistical concepts and methodologies used for the collection and generation of data. They provide information on data quality and, since they are strongly content-oriented, assist users in interpreting the data. Reference metadata, unlike structural metadata, can be decoupled from the data.
[4D1_E2] Eurostat - Environmental statistics and accounts; sustainable development
1.3. Contact name
Confidential because of GDPR
1.4. Contact person function
Confidential because of GDPR
1.5. Contact mail address
L-2920 Luxembourg, LUXEMBOURG
1.6. Contact email address
Confidential because of GDPR
1.7. Contact phone number
Confidential because of GDPR
1.8. Contact fax number
Confidential because of GDPR
2.1. Metadata last certified
15 June 2026
2.2. Metadata last posted
17 June 2025
2.3. Metadata last update
15 June 2026
3.1. Data description
Economy-wide material flow accounts (EW-MFA) provide an aggregate overview, in thousand tonnes per year, of the material flows into and out of an economy. EW-MFA cover solid, gaseous, and liquid materials, except for bulk flows of water and air. Like the system of national accounts, EW-MFA constitute a multi-purpose information system. The detailed material flows provide a rich empirical database for numerous analytical purposes. Further, EW-MFA are used to derive various material flow indicators.
This metadata refers to the following six datasets based on Eurostat’s EW-MFA data collection:
Material flow accounts (env_ac_mfa): this dataset provides certain flow aggregates in a detailed breakdown by materials as mandatorily requested according toRegulation (EU) 691/2011, namely domestic extraction of materials, physical imports, and physical exports – and derived indicators such as e.g. domestic material consumption (DMC).
Material flow accounts - domestic processed output (env_ac_mfadpo): this dataset provides a material flow aggregate termed 'domestic processed output' in a breakdown by detailed materials.
Material flow accounts - balancing items (env_ac_mfabi): this dataset provides balancing items which are required to articulate a consistent material input-output balance of a national economy.
Resource productivity (env_ac_rp): this dataset provides ratios of gross domestic product (GDP) over domestic material consumption (DMC) in various units of measure (see also item 4 of metadata). The term 'resource productivity' designates an indicator that reflects the GDP generated per unit of resources used by the economy. This is typically a macro-economic concept that can be presented alongside labour or capital productivity.
Material import dependency (env_ac_mid): this dataset provides the ratio of imports (IMP) over direct material inputs (DMI) in percentage. The term 'material import dependency' shows the extent to which an economy relies upon imports in order to meet its material needs. Material import dependency cannot be negative or higher than 100%. Values equal to 100% indicate that there are no domestic extractions.
Material flow accounts - main indicators (env_ac_mfain): this dataset provides highly aggregated indicators derived from EW-MFA:
domestic extraction (DE): DE indicates the total amount of material extracted by resident units from the natural environment for further processing in the economy;
imports (IMP): imports of products in their simple mass weight;
exports (EXP): exports of products in their simple mass weight;
physical trade balance (PTB): physical imports minus physical exports;
direct material input (DMI): DMI indicates the direct input of material into the economy. DMI includes all materials which are of economic value and which are available for use in production and consumption activities and it is calculated as the sum of domestic extraction plus physical imports: DMI = DE + IMP;
domestic material consumption (DMC): DMC indicates the total amount of material actually consumed domestically by resident units (‘apparent consumption’). DMC of a given economy can be calculated as direct material input minus physical exports: DMC = DMI – EXP. In general, DMC is additive across countries. However, this feature does not apply to Eurostat's EW-MFA dataset due to the methodology for calculating physical trade for the aggregated EU economy (see point 18.5 of metadata);
domestic processed output (DPO): DPO indicates the amounts of solid, liquid and gaseous materials (excluding water and respiratory carbon dioxide) supplied by the national economy and taken up by the natural environment, particularly by the atmosphere;
balancing items (BI): balancing items enable the balancing of material input and output related to a national economy. Two groupings of balancing items are distinguishable: first, BI to be added to material input, such as oxygen for combustion processes and respiration, and nitrogen; secondly, BI to be added to material output, such as water vapour from combustion and gases from respiration. 'Total BI' designates the difference between 'BI: input side' and 'BI: output side', i.e. 'BI (input -output)';
net additions to stock (NAS): NAS is a measure for the ‘physical growth of the economy’. Materials in form of buildings, infrastructures, durable goods such as e.g. cars, industry machinery, or household appliances are added to the economy’s material stock each year (gross additions), and old materials are removed from stock as buildings are demolished, and durable goods disposed of (removals). NAS is approximated using the following equation: NAS = DMC - DPO + BI (input-output).
3.2. Classification system
EW-MFA record physical flows of materials in a breakdown by type of flow and in a breakdown by type of material.
Type of flows are e.g. domestic extraction (i.e. natural input flows into economy), domestic processed output (i.e. residual flows towards environment), imports and exports (i.e. product flows between resident units and non-residents).
The breakdown by type of material employs a classification of materials which is addressed in this section. The classification of materials MF.1 to MF.6 is mentioned in the legal base of EW-MFA, namely Regulation (2011) 691, Annex III.
The EW-MFA classification of materials is hierarchical with main material flow categories (1-digit level); i.e. MF.1 to MF.8. Each main category is further broken down, maximal down to 4-digit-level (see also the EW-MFA data structure in Annexes):
1-digit: material category;
2-digit: material class;
3-digit: material group;
4-digit: material sub-group.
The type of material corresponds in a certain way to the type of flow. Most material categories have a one-to-one correspondence to a certain type of flow. The Annex presents these correspondences by cross-tabling the type of material (rows) with the type of flow (columns A, B, D, F and G, which also correspond to the respective EW-MFA questionnaire tables).
The first four material categories MF.1 to MF.4 were initially designed for characterising domestic extraction of materials. The material categories MF.1 to MF.4 are also applied to physical imports and exports. The material categories MF.5 and MF.6 apply to physical imports and physical exports. Material category MF.7 applies exclusively to domestic processed output; while MF.8 solely applies to balancing items.
The classification of MF.1 'biomass', MF.2 'metal ores', MF.3 'non-metallic mineral', and MF.4 'fossil energy materials/carriers' is based pragmatically on the statistical data sources employed to compile domestic extraction for these type of materials, e.g. agriculture, forestry, fishery, and energy statistics. A notable particularity of EW-MFA is the attribution of type of material to physical imports and physical exports. Physical imports and exports are flows of products for which one commonly employs product classifications such as e.g. the Classification of Products by Activity (CPA) or Combined Nomenclature (CN). In EW-MFA traded products are presented by type of material and not by product classification. For this, each CN code is assigned to one and only one MF class. For raw products (e.g. output from mining) this assignment to one and only one MF class is straightforward. However, the further processed the goods are the more they are composed of more than one material. The material-wise assignment of semi-manufactured and finished goods is ambiguous.
Domestic processed outputs are hierarchically classified. Five categories are distinguished at 2-digit level:
MF.7.1 Emissions to air;
MF.7.2 Waste disposal to the environment;
MF.7.3 Emissions to water;
MF.7.4 Dissipative use of products;
MF.7.5 Dissipative losses.
The final category (MF.8) is for the balancing items on the input and output side. Balancing items are a particularity of EW-MFA. They are only introduced for balancing purposes, i.e. needed to establish a material balance for the entire national economy, and are not to be included in the indicators derived from the accounts. Balancing items include two categories: items to be added to material inputs such as oxygen for combustion processes and respiration, and nitrogen; items to be added to material outputs such as water vapour from combustion and gases from respiration. On the input side balancing items constitute natural inputs; on the output side balancing items constitute residuals.
3.3. Coverage - sector
The data refer to national economies as defined in the system of national accounts.
3.4. Statistical concepts and definitions
Conceptually economy-wide material flow accounts (EW-MFA) belong to the international system of environmental economic accounting (SEEA-Central Framework). Furthermore, EW-MFA is one of several physical modules of Eurostat's programme on European environmental economic accounts. It is covered by Regulation (EU) No. 691/2011 on European environmental economic accounts.
EW-MFA are closely related to concepts and definitions of national accounts. Most notably they follow the residence principle, i.e. they record material flows related to resident unit's activities, regardless where those occur geographically.
Further methodological guidelines are provided in various publications by Eurostat (see Eurostat website > Environment > Methodology, heading: 'Material flows and resource productivity').
3.5. Statistical unit
Statistical units differ, depending on the different data sources (e.g. agriculture, forestry and fishery statistics, production statistics, geological surveys, energy statistics, international trade in goods etc.) used to compile EW-MFA.
3.6. Statistical population
EW-MFA include all materials (excluding water and air) crossing the system boundary of the national economy of the reporting country. The latter is demarcated by the conventions of the national accounting system (resident units). In Eurostat's EW-MFA material inputs to the economy cover extractions of natural resources (excluding water and air) from the natural environment and imports of material products (goods) from the rest of the world economy (ROW). Material outputs are disposals of materials to the natural environment and exports of material products and waste to the ROW.
3.7. Reference area
European Union (as aggregate and for each Member State); EFTA countries; EU candidate countries.
3.8. Coverage - Time
Dataset 'material flow accounts' (env_ac_mfa): data are annual and may start with the year 1990 (EU aggregate since 2000).
Dataset 'material flow accounts - domestic processed output'(env_ac_mfadpo): data are annual and may start with the year 1990 (EU aggregate since 2000).
Dataset 'material flow accounts - balancing items'(env_ac_mfabi): data are annual and may start with the year 1990 (EU aggregate since 2000).
Dataset 'material flow accounts - main indicators'(env_ac_mfain): data are annual and may start with the year 1990 (EU aggregate since 2000).
Dataset 'resource productivity' (env_ac_rp): data are annual and may start with the year 2000 (EU aggregate since 2000).
Dataset 'material import dependency' (env_ac_mid): data are annual and may start with the year 1990 (EU aggregate since 2000).
3.9. Base period
Index series are provided for the reference year 2000 (see below item 4 "Unit of measure").
The datasets 'material flow accounts' (env_ac_mfa) and 'material flow accounts - main indicators' (env_ac_mfain) provide data in thousand tonnes, tonnes per capita (using the demographic indicator 'Average population - total') and Indices (2000=100).
The datasets 'material flow accounts - domestic processed output' (env_ac_mfadpo) and 'material flow accounts - balancing items' (env_ac_mfabi) provide data in thousand tonnes, tonnes per capita (using the demographic indicator 'Average population - total').
Various units are employed for the data set 'resource productivity' (env_ac_rp) depending on which type of GDP (current price or volume figures) has been used for calculating the ratio:
'Euro per Kilogram' (GDP in current prices), to be used to analyse a single country at one point in time (for one particular year);
'PPS per Kilogram' (GDP in current prices expressed in Purchasing Power Standards). Purchasing Power Standards are fictive 'currency' units that remove differences in purchasing power, hence eliminate differences in price levels across countries; to be used when comparing across countries at one point in time;
'Euro 2015-based chain linked volumes per kilogram' (GDP in chain-linked volumes normalised to 2015 prices). Volume figures show the development of aggregates excluding inflation; to be used when comparing over time (various years) one single country;
'Index, 2000=100' (based on GDP in chain-linked volumes normalised to 2000 prices).
The dataset 'material import dependency' (env_ac_mid) provides data in percentage (physical imports in relation to direct material inputs (DMI); see item 3.1 above).
The data refer to the calendar years.
6.1. Institutional Mandate - legal acts and other agreements
Economy-wide material flow accounts (EW-MFA) are legally covered by Regulation (EU) 691/2011 on European Environmental Economic Accounts.
6.2. Institutional Mandate - data sharing
Not applicable.
7.1. Confidentiality - policy
Regulation (EC) No 223/2009 on European statistics (recital 24 and Article 20(4)) of 11 March 2009 (OJ L 87, p. 164), stipulates the need to establish common principles and guidelines ensuring the confidentiality of data used for the production of European statistics and the access to those confidential data with due account for technical developments and the requirements of users in a democratic society.
7.2. Confidentiality - data treatment
Confidential data are flagged 'c)' and not published. For aggregates of confidential data, Eurostat's rules for confidentiality are respected.
8.1. Release calendar
The deadline for submitting the annual EW-MFA questionnaire is 30 April (T = deadline). Data are published ca. 3 months later, around end of June, including early estimates for the flow types domestic extraction, imports, and exports.
8.2. Release calendar access
Not applicable.
8.3. Release policy - user access
In line with the Community legal framework and the European Statistics Code of Practice Eurostat disseminates European statistics on Eurostat's website (see item 10 - 'Accessibility and clarity') respecting professional independence and in an objective, professional and transparent manner in which all users are treated equitably. The detailed arrangements are governed by the Eurostat protocol on impartial access to Eurostat data for users.
See above item 8.1.
10.1. Dissemination format - News release
No news release on EW-MFA is scheduled in Eurostat's 2026 Release calendar.
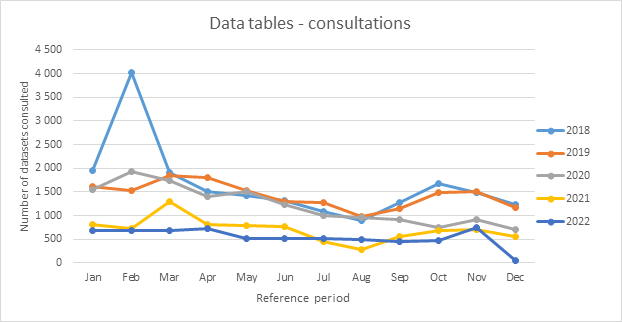
The chart below provides the page views (the number of times a page was visited) as of the relase of the 2024 data collection, of the following datasets: Material flow accounts [env_ac_mfa]; Material flow accounts - main indicators [env_ac_mfain]; Resource productivity [env_ac_rp].
10.4. Dissemination format - microdata access
Not applicable.
10.5. Dissemination format - other
See point 3.1 of metadata.
10.5.1. Metadata - consultations
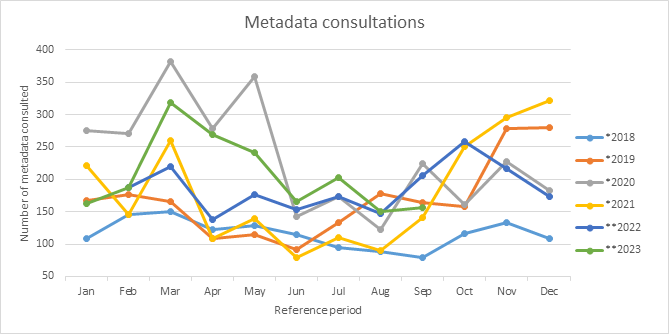
The chart below provides the page views (the number of times a page was visited) as of the relase of the 2024 data collection, of the EW-MFA metadata.
10.6. Documentation on methodology
Information (e.g. manuals, electronic questionnaires) is available on Eurostat's website.
10.6.1. Metadata completeness - rate
Metadata completeness - rate
This quality performance indicator presents the ‘ratio of completeness’ by country of the 2025 data collection. It is defined as the number of metadata elements provided by countries in relation to the total number of metadata elements applicable.
The following parameters are taken into account:
GEO: EU, Member States
REFERENCE PERIOD = 2025 data collection cycle
Ratio of completeness: number of metadata elements provided over total number of metadata elements applicable
The total number of metadata elements applicable include the following concepts:
With this metadata file at hand Eurostat provides an overall evaluation of EW-MFA data quality based on national quality reports sent by Member States.
11.1. Quality assurance
To ensure quality of EW-MFA data Eurostat implemented the following quality assurance elements:
1) Methodological guidelines to assist countries in compiling and providing internationally harmonised EW-MFA;
2) A wide range of validation procedures to check the quality of data received. The validation procedures check:
completeness;
symbols;
internal consistency;
correctness of footnotes and confidentiality;
plausibility of reported time series (annual change rates);
plausibility of revisions;
external consistency (cross-domain plausibility).
3) Gap-filling of missing statistical information (see also item 18.5).
11.2. Quality management - assessment
Quality management is good. Validation procedures, estimation of missing statistical data (gap-filling) and quality reporting are in place. The working group on environmental accounts, encompassing representatives of all Member States, Eurostat and other stakeholders, discusses quality improvements.
EW-MFA is a relatively mature data collection, which started in 2013 according to Regulation 691/2011. Data quality could still be improved in particular for some quantitative important elements, which need to be estimated (e.g. sand and gravel extraction, grazed biomass).
Each year around end of June Eurostat produces and publishes early estimates of the domestic extraction of materials for the preceding year (e.g. in June 2022 for reference year 2021). Each year, Eurostat provides a report that assesses the quality of the early estimates by analysing the estimation error.
Please find the most recent report (PDF) annexed here:
Users of economy-wide material flow accounts (EW-MFA) and derived indicators include policy makers in environmental ministries, environmental organisations, researchers, students and interested citizens.
More information on the policy context can be found website.
12.2. Relevance - User Satisfaction
There are no systematic studies of user satisfaction. Eurostat has regular hearings with European policymakers and contacts with the research community and other stakeholders to monitor the relevance of the statistics produced and identify new priorities.
12.3. Completeness
Data are complete for all Member States and EU aggregates starting from the year 2000.
12.3.1. Data completeness - rate
Data completeness rate This quality performance indicator presents data completeness rates of the 2025 data collection by geographical entity taking into account the following parameters:
GEO EU, Member States
INDIC_ENV = DE, IMP, EXP
REFERENCE PERIOD = 5 legally mandatory reference years
Remarks:
Indicator completeness rate is the ratio between reported legally mandatory cells and expected mandatory cells.
The range of expected cells encompasses data points for which countries must deliver numeric values based on legal base.
Data points (cells) with s-flag (Eurostat estimate) are considered as ‘delivered by country’.
13.1. Accuracy - overall
Economy-wide material flow accounts (EW-MFA) are compiled from a wide range of data sources (e.g. agriculture, forestry and fishery statistics, production statistics, geological surveys, energy statistics, foreign trade statistics etc.). The overall accuracy is considered good.
13.2. Sampling error
Not applicable because data are not based on a sample survey.
13.2.1. Sampling error - indicators
Not applicable because data are not based on a sample survey.
13.3. Non-sampling error
Not applicable.
13.3.1. Coverage error
Not applicable.
13.3.1.1. Over-coverage - rate
Not applicable.
13.3.1.2. Common units - proportion
Not applicable.
13.3.2. Measurement error
Not applicable.
13.3.3. Non response error
Not applicable.
13.3.3.1. Unit non-response - rate
Not applicable.
13.3.3.2. Item non-response - rate
Not applicable.
13.3.4. Processing error
Not applicable.
13.3.5. Model assumption error
Not applicable.
14.1. Timeliness
Eurostat collects economy-wide material flow accounts from national statistical institutes (NSI) via an annual questionnaire (see 6.1 for legal base). Reporting deadline for the questionnaire is 30 April of the year T (T = deadline and year into which the deadline falls). The most recent mandatory reference year for which NSI have to report is T-2 years. Only a few NSI report data for one more year (T-1y). For domestic extraction and physical imports and exports, Eurostat produces and publishes early estimates for year T-1y.
14.1.1. Time lag - first result
Not applicable.
14.1.2. Time lag - final result
Not applicable.
14.2. Punctuality
All Member States are currently able to meet the transmission deadline. Eurostat publishes preliminary aggregates using, if necessary, estimates for missing countries.
14.2.1. Punctuality - delivery and publication
Punctuality of data delivery by country and Eurostat data dissemination
This quality performance indicator on the 2025 data collection presents several metrics related to the punctuality of data delivery and publication taking into account the following parameters:
GEO = EU, Member States
INDIC_ENV = DE, IMP, EXP
REFERENCE PERIOD = 2025 data collection
DEADLINE FOR DELIVERY = 30 April 2025
DATE OF DATA DISSEMINATION = 4 July 2025
15.1. Comparability - geographical
The comparability across countries is good due to clear statistical concepts and definitions. However, the national data sources used for the compilation of EW-MFA by the national statistical institutes may differ in scope and quality.
15.1.1. Asymmetry for mirror flow statistics - coefficient
Not applicable because physical imports and exports as recorded in EW-MFA are not specified by origin and/or destination.
15.2. Comparability - over time
The comparability over time is good due to clear statistical concepts and definitions. Revisions in methodology are usually applied backwards to the entire time series.
15.2.1. Length of comparable time series
Length of comparable time series
This quality performance indicator presents the number of ‘breaks in time series’ taking into account the following parameters:
GEO = EU Member States
INDIC_ENV = DE, IMP, EXP
COUNTING BREAKS IN SERIES = number of "b) flag"
REFERENCE PERIOD = as of 2000. Each reference year has 195 mandatory cells (datapoints)
mandatory reference years: orange cells
non-mandatory reference years: yellow cells
Comparing three most recent data collection cycles
15.3. Coherence - cross domain
Eurostat performs cross-domain plausibility checking between EW-MFA data and data from other statistical domains - e.g. PRODCOM (production statistics), COMEXT (international trade in goods statistics), ENERGY STATISTICS, AGRICULTURE STATISTICS, AIR EMISSIONS ACCOUNTS - by verifying whether data are in accordance with certain basic criteria that serve to assess the plausibility of the given data.
15.3.1. Coherence - sub annual and annual statistics
Not applicable; reported EW-MFA data are only annual.
15.3.2. Coherence - National Accounts
The data are coherent with national accounts and environmental-economic accounts.
15.4. Coherence - internal
The internal coherence is very high, ensured by the accounting framework.
Depending on the level of automatisation the costs and burden range from 5 to 40 person-days per country and approx. 200 person-days for Eurostat.
17.1. Data revision - policy
To further specify the general Eurostat revision policy, the following revision policy has been established for economy wide material flow accounts: every year Eurostat publishes the complete time series, which may lead to revisions of data previously published.
17.2. Data revision - practice
All reported errors (once validated) result in corrections of the disseminated data.
Reported errors are corrected in the disseminated data as soon as the correct data have been validated.
Data may be published even if they are missing for certain countries or flagged as provisional or of low reliability for certain countries. They are replaced with final data once transmitted and validated. European aggregates are updated for consistency with new country data. Aggregates and components are revised at the same time.
For domestic extraction and physical imports and exports, Eurostat produces and publishes early estimates for year T-1y in July. These data are revised in the following year data collection.
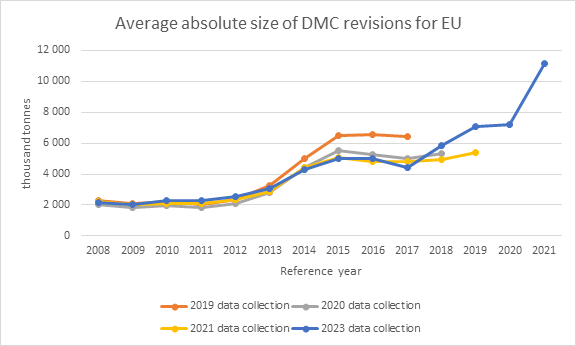
17.2.1. Data revision - average size
Average DMC revisions by country and year
This quality performance indicator presents the average size of revisions for the EW-MFA indicator DMC within the prevoius data collections. The following parameters are taken into account:
GEO: EU, Member States
INDIC_ENV: DMC
MATERIAL: MF TOTAL
UNIT: thousand tonnes
Remarks: - For each reference year (columns in below table), the absolute revision size for DMC is calculated between two consecutive collection cycles. This is done for each data collection cycle. Then, the average is calculated over the number of data collection cycles. - Note that for reference year 2017 the average is built on five data collection cycles. For reference year 2018 the average is built on four data collection cycles and so on.
Comparing data collection cycles (2019-2025)
The more recent data collection cycles show significant increases of the average absolute revisions of DMC for the three most recent reference years due to revisions of Eurostat's early estimates (see also point 11.2 of metadata).
18.1. Source data
National statistical institutes (NSI) compile economy-wide material flow accounts (EW-MFA) based on a wide range of statistical data sources (e.g. agriculture, forestry and fishery statistics, production statistics, geological surveys, energy statistics, foreign trade statistics etc.). In some cases, estimation procedures are applied where no data sources are available. Eurostat provides standardised estimation procedures.
The annual EW-MFA questionnaire is available on Eurostat's website. Eurostat receives the questionnaires via eDAMIS (electronic Data files Administration and Management Information System), the standard tool for the transmission of data and metadata to Eurostat. The system provides a secure environment for the transmission of data and offers logging of all transmissions and sends confirmations of delivery.
18.4. Data validation
Data are extensively checked by Eurostat using comprehensive validation procedures (IT tools). Checks are carried out essentially to ensure that the transmission of the requested data has been carried out satisfactorily, that datasets are complete and error-free.
Where necessary, Eurostat gap-fills missing data using national and international data sources (e.g. foreign trade statistics, agriculture statistics, energy statistics, production statistics etc.).
18.5. Data compilation
Methodology for the estimates of the EU aggregates:
Eurostat derives EU aggregates bottom-up, i.e. by summing up country data, except for physical imports and exports., for which a special methodology is applied as described in the following:
Eurostat derives physical trade for the aggregated EU economy (which is extra-EU imports and exports for EU countries) by using Comext database, i.e. Eurostat's reference database for detailed European statistics on international trade in goods (ITGS). Only extra-EU trade is taken into account for the aggregated EU.
Please note that due to this methodology the physical imports and physical exports of the aggregated EU do not equal the sum of Member States' trade figures.
Adjustment for residence principle: fuel bunkered by resident units abroad (item MF 4.2.3 of the EW-MFA questionnaire Table B IMPORTS): this item of the EW-MFA classification is estimated for the aggregated EU economy. Based on historical data it is assumed to be 8% of the total extra-EU imports extracted from Comext ITGS database.
Adjustment for residence principle: fuel bunkered by non-resident units domestically (item MF 4.2.3 of the EW-MFA questionnaire Table D EXPORTS): this item is estimated zero for the aggregated EU economy. Comext ITGS exports include already supplies on the territory of the reporting country to ships and aircraft which are destined to leave the territory of this country on-board.
Methodology for gap-filling and early estimates:
- Gap-filling T-1 year (June): For physical imports and physical exports, Eurostat performs gap-filling at the most detailed material breakdown for each EU Member State and the aggregated EU. The gap-filling is based on international trade in goods statistics (ITGS).
Early estimatesT-1 year (June):For domestic extraction Eurostat makes early estimates for the 4 main material categories for each EU Member State and the aggregated EU. These early estimates are based on statistical modelling (mainly regression-type models). For each of the main material categories a number of potential predictors have been identified which are available by the middle of the year (e.g. gross value added by NACE sections, production volume indices from short-term business statistics, monthly energy statistics etc.). Predictors and prediction models are country and material specific.
18.5.1. Imputation - rate
Not applicable.
18.6. Adjustment
Not applicable; i.e. in EW-MFA no time series adjustment necessary.
18.6.1. Seasonal adjustment
Not applicable.
No further comment.
Economy-wide material flow accounts (EW-MFA) provide an aggregate overview, in thousand tonnes per year, of the material flows into and out of an economy. EW-MFA cover solid, gaseous, and liquid materials, except for bulk flows of water and air. Like the system of national accounts, EW-MFA constitute a multi-purpose information system. The detailed material flows provide a rich empirical database for numerous analytical purposes. Further, EW-MFA are used to derive various material flow indicators.
This metadata refers to the following six datasets based on Eurostat’s EW-MFA data collection:
Material flow accounts (env_ac_mfa): this dataset provides certain flow aggregates in a detailed breakdown by materials as mandatorily requested according toRegulation (EU) 691/2011, namely domestic extraction of materials, physical imports, and physical exports – and derived indicators such as e.g. domestic material consumption (DMC).
Material flow accounts - domestic processed output (env_ac_mfadpo): this dataset provides a material flow aggregate termed 'domestic processed output' in a breakdown by detailed materials.
Material flow accounts - balancing items (env_ac_mfabi): this dataset provides balancing items which are required to articulate a consistent material input-output balance of a national economy.
Resource productivity (env_ac_rp): this dataset provides ratios of gross domestic product (GDP) over domestic material consumption (DMC) in various units of measure (see also item 4 of metadata). The term 'resource productivity' designates an indicator that reflects the GDP generated per unit of resources used by the economy. This is typically a macro-economic concept that can be presented alongside labour or capital productivity.
Material import dependency (env_ac_mid): this dataset provides the ratio of imports (IMP) over direct material inputs (DMI) in percentage. The term 'material import dependency' shows the extent to which an economy relies upon imports in order to meet its material needs. Material import dependency cannot be negative or higher than 100%. Values equal to 100% indicate that there are no domestic extractions.
Material flow accounts - main indicators (env_ac_mfain): this dataset provides highly aggregated indicators derived from EW-MFA:
domestic extraction (DE): DE indicates the total amount of material extracted by resident units from the natural environment for further processing in the economy;
imports (IMP): imports of products in their simple mass weight;
exports (EXP): exports of products in their simple mass weight;
physical trade balance (PTB): physical imports minus physical exports;
direct material input (DMI): DMI indicates the direct input of material into the economy. DMI includes all materials which are of economic value and which are available for use in production and consumption activities and it is calculated as the sum of domestic extraction plus physical imports: DMI = DE + IMP;
domestic material consumption (DMC): DMC indicates the total amount of material actually consumed domestically by resident units (‘apparent consumption’). DMC of a given economy can be calculated as direct material input minus physical exports: DMC = DMI – EXP. In general, DMC is additive across countries. However, this feature does not apply to Eurostat's EW-MFA dataset due to the methodology for calculating physical trade for the aggregated EU economy (see point 18.5 of metadata);
domestic processed output (DPO): DPO indicates the amounts of solid, liquid and gaseous materials (excluding water and respiratory carbon dioxide) supplied by the national economy and taken up by the natural environment, particularly by the atmosphere;
balancing items (BI): balancing items enable the balancing of material input and output related to a national economy. Two groupings of balancing items are distinguishable: first, BI to be added to material input, such as oxygen for combustion processes and respiration, and nitrogen; secondly, BI to be added to material output, such as water vapour from combustion and gases from respiration. 'Total BI' designates the difference between 'BI: input side' and 'BI: output side', i.e. 'BI (input -output)';
net additions to stock (NAS): NAS is a measure for the ‘physical growth of the economy’. Materials in form of buildings, infrastructures, durable goods such as e.g. cars, industry machinery, or household appliances are added to the economy’s material stock each year (gross additions), and old materials are removed from stock as buildings are demolished, and durable goods disposed of (removals). NAS is approximated using the following equation: NAS = DMC - DPO + BI (input-output).
15 June 2026
Conceptually economy-wide material flow accounts (EW-MFA) belong to the international system of environmental economic accounting (SEEA-Central Framework). Furthermore, EW-MFA is one of several physical modules of Eurostat's programme on European environmental economic accounts. It is covered by Regulation (EU) No. 691/2011 on European environmental economic accounts.
EW-MFA are closely related to concepts and definitions of national accounts. Most notably they follow the residence principle, i.e. they record material flows related to resident unit's activities, regardless where those occur geographically.
Further methodological guidelines are provided in various publications by Eurostat (see Eurostat website > Environment > Methodology, heading: 'Material flows and resource productivity').
Statistical units differ, depending on the different data sources (e.g. agriculture, forestry and fishery statistics, production statistics, geological surveys, energy statistics, international trade in goods etc.) used to compile EW-MFA.
EW-MFA include all materials (excluding water and air) crossing the system boundary of the national economy of the reporting country. The latter is demarcated by the conventions of the national accounting system (resident units). In Eurostat's EW-MFA material inputs to the economy cover extractions of natural resources (excluding water and air) from the natural environment and imports of material products (goods) from the rest of the world economy (ROW). Material outputs are disposals of materials to the natural environment and exports of material products and waste to the ROW.
European Union (as aggregate and for each Member State); EFTA countries; EU candidate countries.
The data refer to the calendar years.
Economy-wide material flow accounts (EW-MFA) are compiled from a wide range of data sources (e.g. agriculture, forestry and fishery statistics, production statistics, geological surveys, energy statistics, foreign trade statistics etc.). The overall accuracy is considered good.
The datasets 'material flow accounts' (env_ac_mfa) and 'material flow accounts - main indicators' (env_ac_mfain) provide data in thousand tonnes, tonnes per capita (using the demographic indicator 'Average population - total') and Indices (2000=100).
The datasets 'material flow accounts - domestic processed output' (env_ac_mfadpo) and 'material flow accounts - balancing items' (env_ac_mfabi) provide data in thousand tonnes, tonnes per capita (using the demographic indicator 'Average population - total').
Various units are employed for the data set 'resource productivity' (env_ac_rp) depending on which type of GDP (current price or volume figures) has been used for calculating the ratio:
'Euro per Kilogram' (GDP in current prices), to be used to analyse a single country at one point in time (for one particular year);
'PPS per Kilogram' (GDP in current prices expressed in Purchasing Power Standards). Purchasing Power Standards are fictive 'currency' units that remove differences in purchasing power, hence eliminate differences in price levels across countries; to be used when comparing across countries at one point in time;
'Euro 2015-based chain linked volumes per kilogram' (GDP in chain-linked volumes normalised to 2015 prices). Volume figures show the development of aggregates excluding inflation; to be used when comparing over time (various years) one single country;
'Index, 2000=100' (based on GDP in chain-linked volumes normalised to 2000 prices).
The dataset 'material import dependency' (env_ac_mid) provides data in percentage (physical imports in relation to direct material inputs (DMI); see item 3.1 above).
Methodology for the estimates of the EU aggregates:
Eurostat derives EU aggregates bottom-up, i.e. by summing up country data, except for physical imports and exports., for which a special methodology is applied as described in the following:
Eurostat derives physical trade for the aggregated EU economy (which is extra-EU imports and exports for EU countries) by using Comext database, i.e. Eurostat's reference database for detailed European statistics on international trade in goods (ITGS). Only extra-EU trade is taken into account for the aggregated EU.
Please note that due to this methodology the physical imports and physical exports of the aggregated EU do not equal the sum of Member States' trade figures.
Adjustment for residence principle: fuel bunkered by resident units abroad (item MF 4.2.3 of the EW-MFA questionnaire Table B IMPORTS): this item of the EW-MFA classification is estimated for the aggregated EU economy. Based on historical data it is assumed to be 8% of the total extra-EU imports extracted from Comext ITGS database.
Adjustment for residence principle: fuel bunkered by non-resident units domestically (item MF 4.2.3 of the EW-MFA questionnaire Table D EXPORTS): this item is estimated zero for the aggregated EU economy. Comext ITGS exports include already supplies on the territory of the reporting country to ships and aircraft which are destined to leave the territory of this country on-board.
Methodology for gap-filling and early estimates:
- Gap-filling T-1 year (June): For physical imports and physical exports, Eurostat performs gap-filling at the most detailed material breakdown for each EU Member State and the aggregated EU. The gap-filling is based on international trade in goods statistics (ITGS).
Early estimatesT-1 year (June):For domestic extraction Eurostat makes early estimates for the 4 main material categories for each EU Member State and the aggregated EU. These early estimates are based on statistical modelling (mainly regression-type models). For each of the main material categories a number of potential predictors have been identified which are available by the middle of the year (e.g. gross value added by NACE sections, production volume indices from short-term business statistics, monthly energy statistics etc.). Predictors and prediction models are country and material specific.
National statistical institutes (NSI) compile economy-wide material flow accounts (EW-MFA) based on a wide range of statistical data sources (e.g. agriculture, forestry and fishery statistics, production statistics, geological surveys, energy statistics, foreign trade statistics etc.). In some cases, estimation procedures are applied where no data sources are available. Eurostat provides standardised estimation procedures.
See above item 8.1.
Eurostat collects economy-wide material flow accounts from national statistical institutes (NSI) via an annual questionnaire (see 6.1 for legal base). Reporting deadline for the questionnaire is 30 April of the year T (T = deadline and year into which the deadline falls). The most recent mandatory reference year for which NSI have to report is T-2 years. Only a few NSI report data for one more year (T-1y). For domestic extraction and physical imports and exports, Eurostat produces and publishes early estimates for year T-1y.
The comparability across countries is good due to clear statistical concepts and definitions. However, the national data sources used for the compilation of EW-MFA by the national statistical institutes may differ in scope and quality.
The comparability over time is good due to clear statistical concepts and definitions. Revisions in methodology are usually applied backwards to the entire time series.