

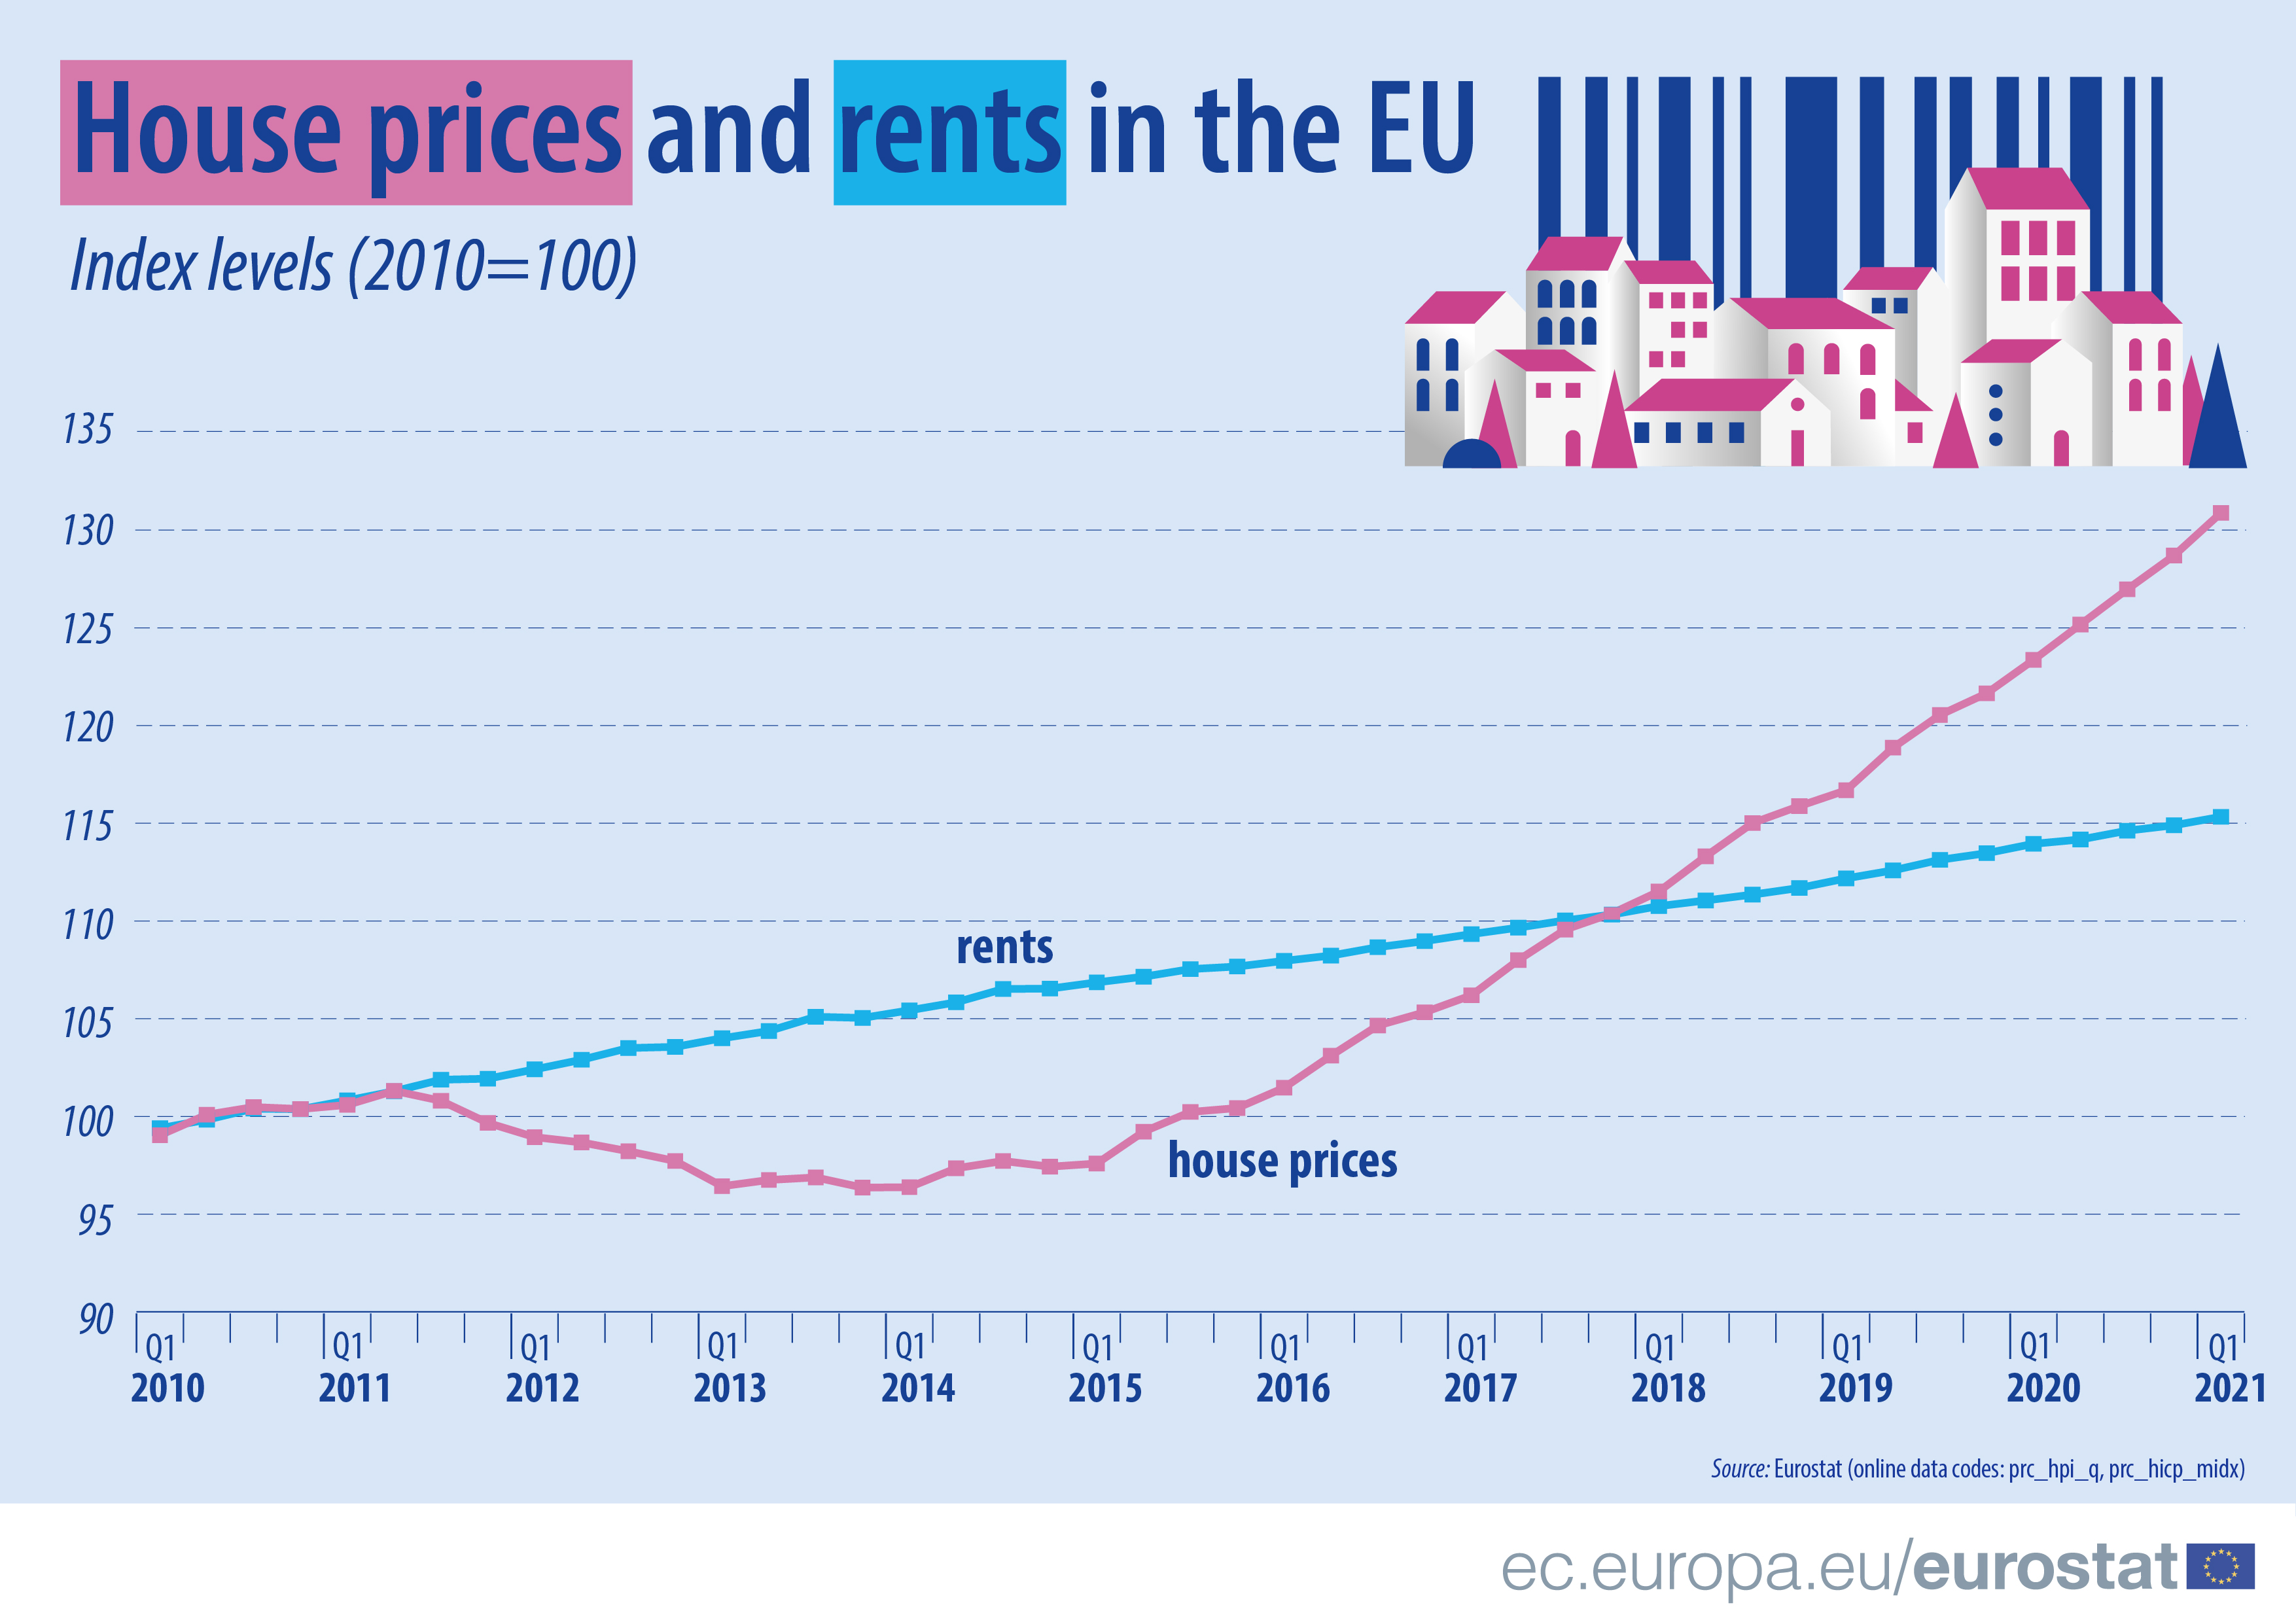
Rents and house prices in the EU have continued their steady increase in the first quarter of 2021, going up by 0.4 % and 2.2 %, respectively, compared to the fourth quarter 2020.
Between 2010 and the second quarter of 2011, house prices and rents in the EU followed similar paths. Since the second quarter of 2011, they have followed very different paths: while rents increased steadily throughout the period up to the first quarter of 2021, house prices have fluctuated significantly.
After a sharp decline between the second quarter of 2011 and the first quarter of 2013, house prices remained more or less stable between 2013 and 2014. Then, there was a rapid rise in early 2015, since when house prices have increased at a much faster pace than rents.
Over the period 2010 until the first quarter of 2021, rents increased by 15.3% and house prices by 30.9%.
Data source: prc_hpi_q, prc_hicp_midx
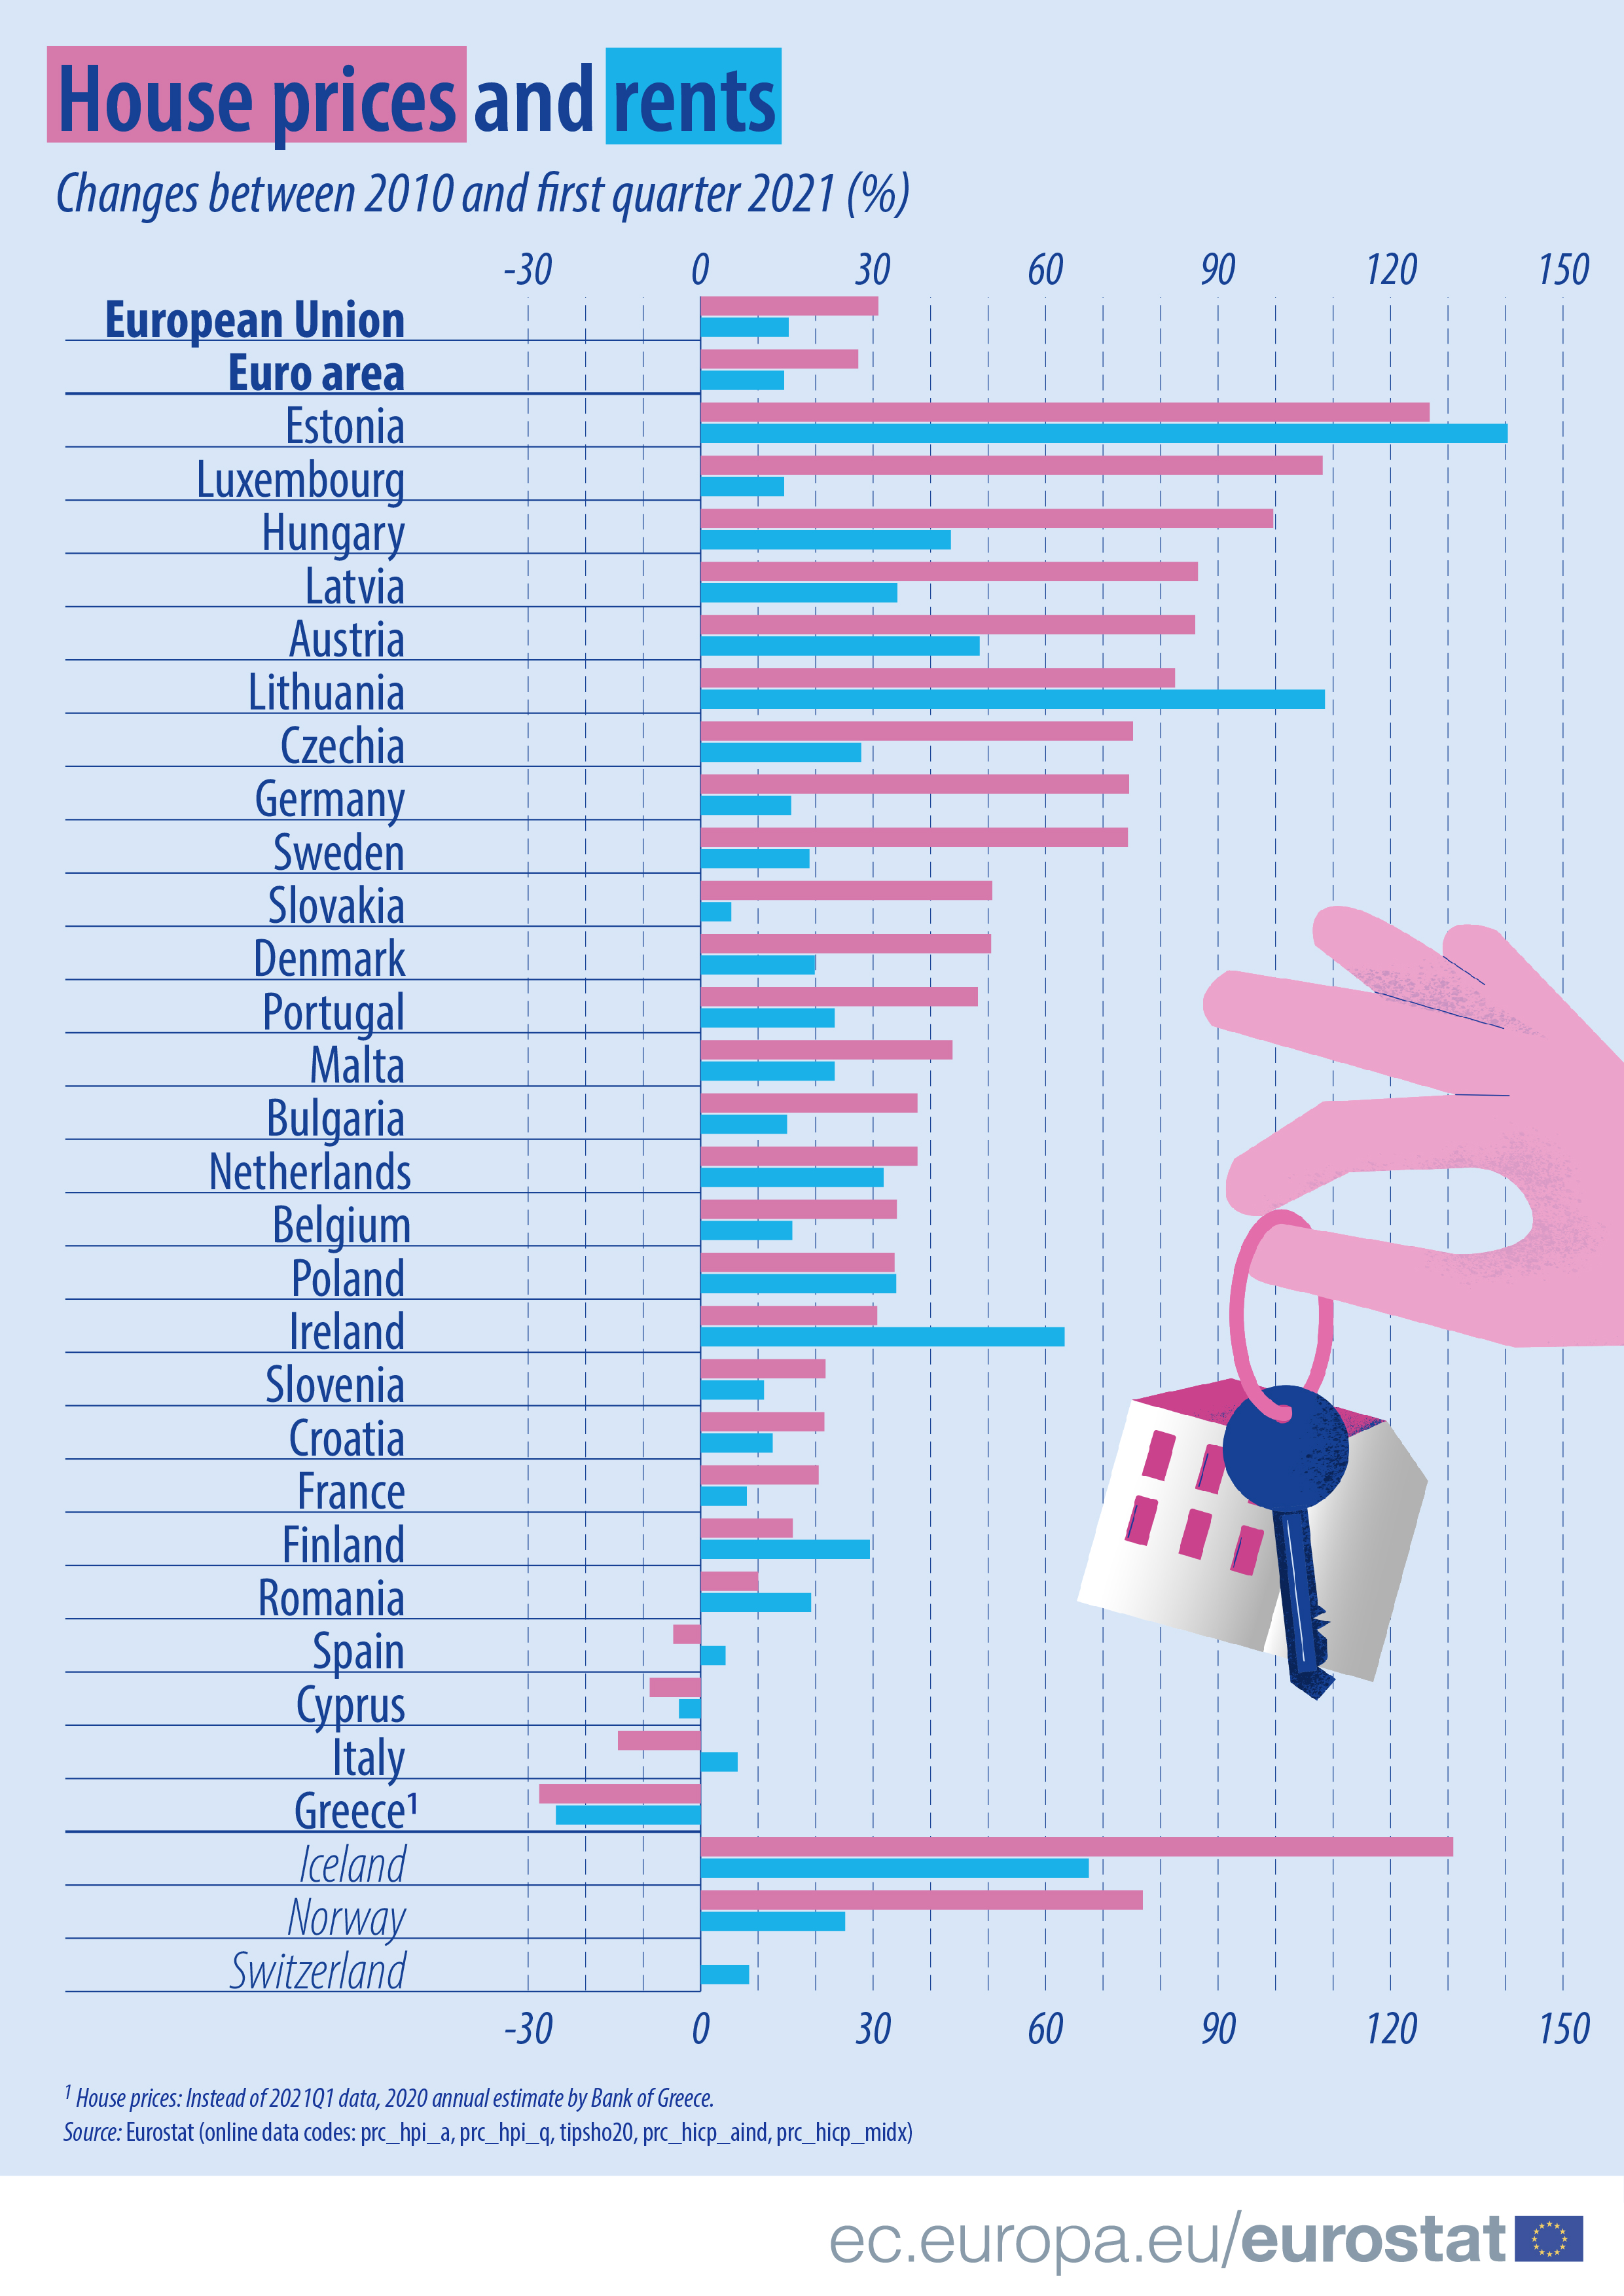
Estonia records highest increases for house prices and rents since 2010
When comparing the first quarter of 2021 with 2010, house prices increased more than rents in 17 EU Member States. House prices increased in 23 Member States and decreased in four, with the highest rises in Estonia (+126.8%) and Luxembourg (+108.2%). Decreases were observed in Greece (-28.1%, see note), Italy (-14.4%), Cyprus (-8.9%) and Spain (-4.8%).
For rents, the pattern was different. When comparing the first quarter of 2021 with 2010, prices increased in 25 EU Member States and decreased in two, with the highest rises in Estonia (+140.4%), Lithuania (+108.6%) and Ireland (+63.3%). Decreases were recorded in Greece (-25.2%) and Cyprus (-3.8%).
Data source: prc_hpi_a, prc_hpi_q, tipsho20, prc_hicp_aind, prc_hicp_midx
For more information:
- Read our Statistics Explained article on Housing price statistics – house price index
- Data for Greece: instead of the first quarter of 2021, 2020 annual estimate by Bank of Greece.
To contact us, please visit our User Support page.
For press queries, please contact our Media Support.