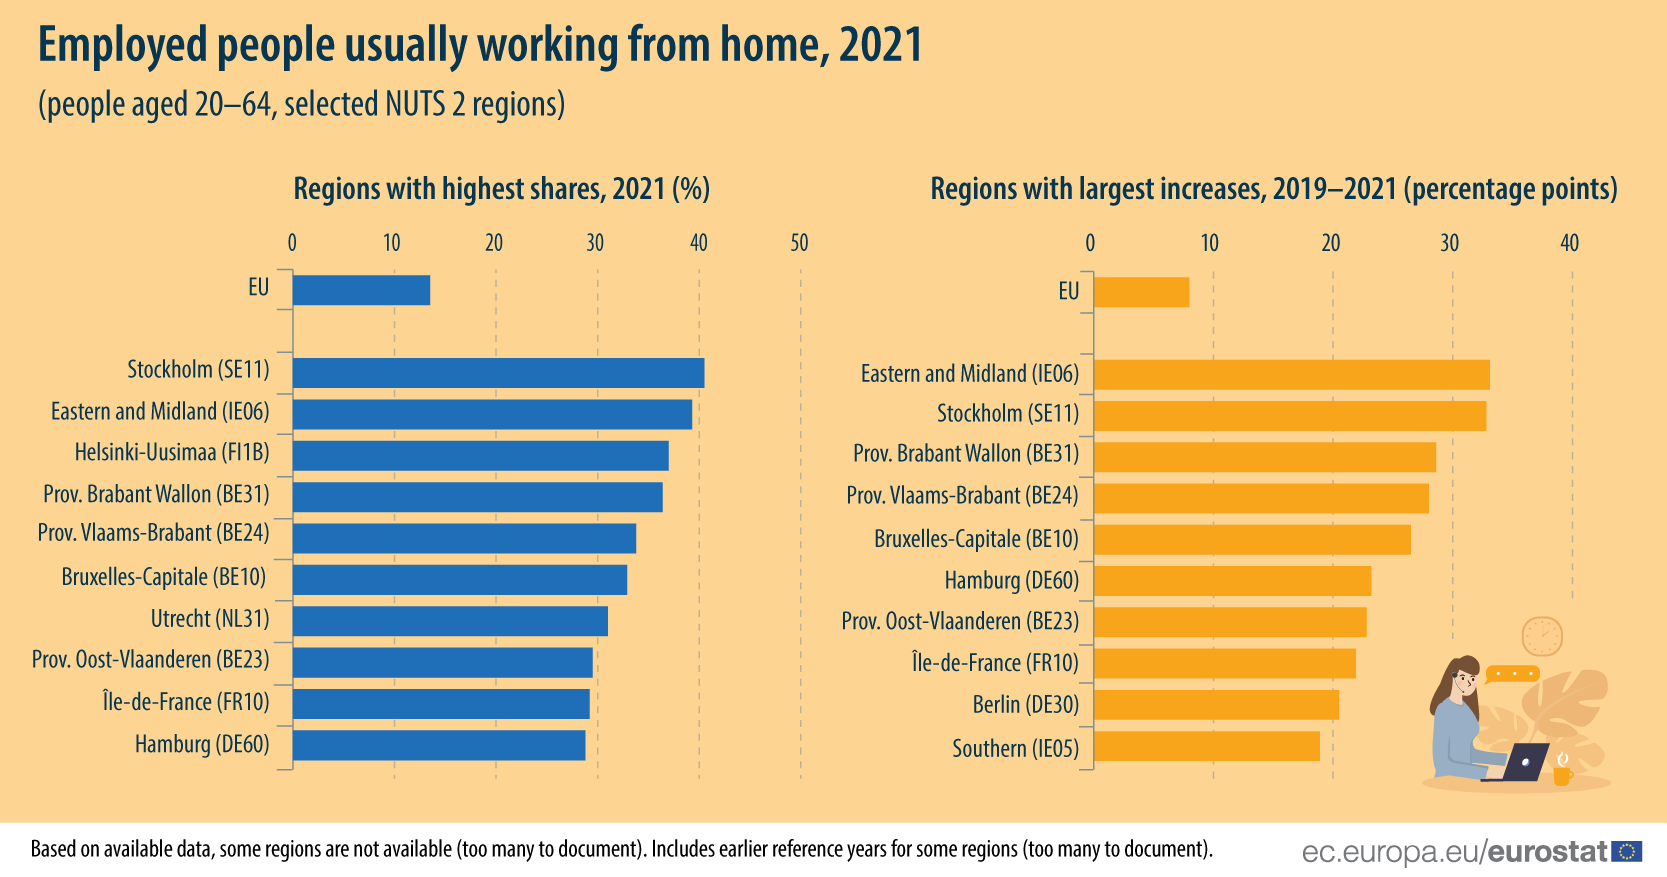
During the COVID-19 crisis, a large proportion of employed people was faced with changing patterns of work – including working from home. In 2019, approximately 1 in 20 (5.5%) employed people aged 20–64 years in the EU usually worked from home. The impact of the COVID-19 crisis was apparent as this share more than doubled in 2020 to 12.3% (+6.8 percentage points; pp). To a lesser extent, there was a further increase in the share of people usually working from home in 2021, as it reached 13.5% (+1.2 pp).
The regional distribution of working from home in 2021 was somewhat skewed, insofar as there were 95 NUTS level 2 regions where this share was above the EU average, compared with 140 regions that recorded lower than average shares.
Source dataset: 04_Labour_market_RYB2022 (Figure 4.1)
Two in five employees in Stockholm usually worked from home
In Stockholm – the capital region of Sweden – two out of every five employed people (or 40.5%) were usually working from home in 2021. This was the highest share across NUTS level 2 regions, with two more capital regions recording the next highest shares: Eastern and Midland in Ireland (39.3% of employed people) and Helsinki-Uusimaa in Finland (37.0%).
Increases in employed people usually working from home
The share of employed people in the EU usually working from home rose by 8.0 percentage points between 2019 and 2021. Perhaps the most striking aspect concerns the rapid increase in the proportion of employed people who were working from home in several capital and urban regions.
In Eastern and Midland in Ireland and in Stockholm in Sweden, the increases were +33.1 pp and +32.8 pp, respectively. In other words, when comparing the pre-pandemic situation in 2019 with the situation in 2021, the share of employed people usually working from home increased in these two capital regions by an amount that was more than four times as high as the increase for the EU average.
Would you like to know more about employment statistics in the EU?
- You can read more in the dedicated section of the Regions in Europe - 2022 interactive edition.
- You can also read more in the Eurostat regional yearbook - 2022 edition, also available as a set of Statistics Explained articles.
- The corresponding maps in the Statistical Atlas provide a full-screen interactive map experience.
For more information:
- Dedicated section on employment statistics
- Database on employment statistics
- Dedicated section on regions and cities
- Database on regional data
Methodological notes:
- “Usually working from home” means doing at home any productive work related to the current main job for at least half of the days worked in a reference period of four weeks. Employment and remote work in 2021 is also analysed in the Statistics Explained article on employment - annual statistics.
- Data in this article come from EU Labour Force Survey (EU-LFS). There is a new legal basis for EU-LFS from 2021 onwards: Regulation (EU) 2019/1700. This new legal basis implies a break in series between 2020 and 2021; results obtained before and after 1 January 2021 are consequently not fully comparable.
- In this article, the regional data are presented at NUTS 2 level. There are 242 regions at NUTS 2 level.
- Based on available data, some regions are not available (too many to document). Includes earlier reference years for some regions (too many to document).
To contact us, please visit our User Support page.
For press queries, please contact our Media Support.


