
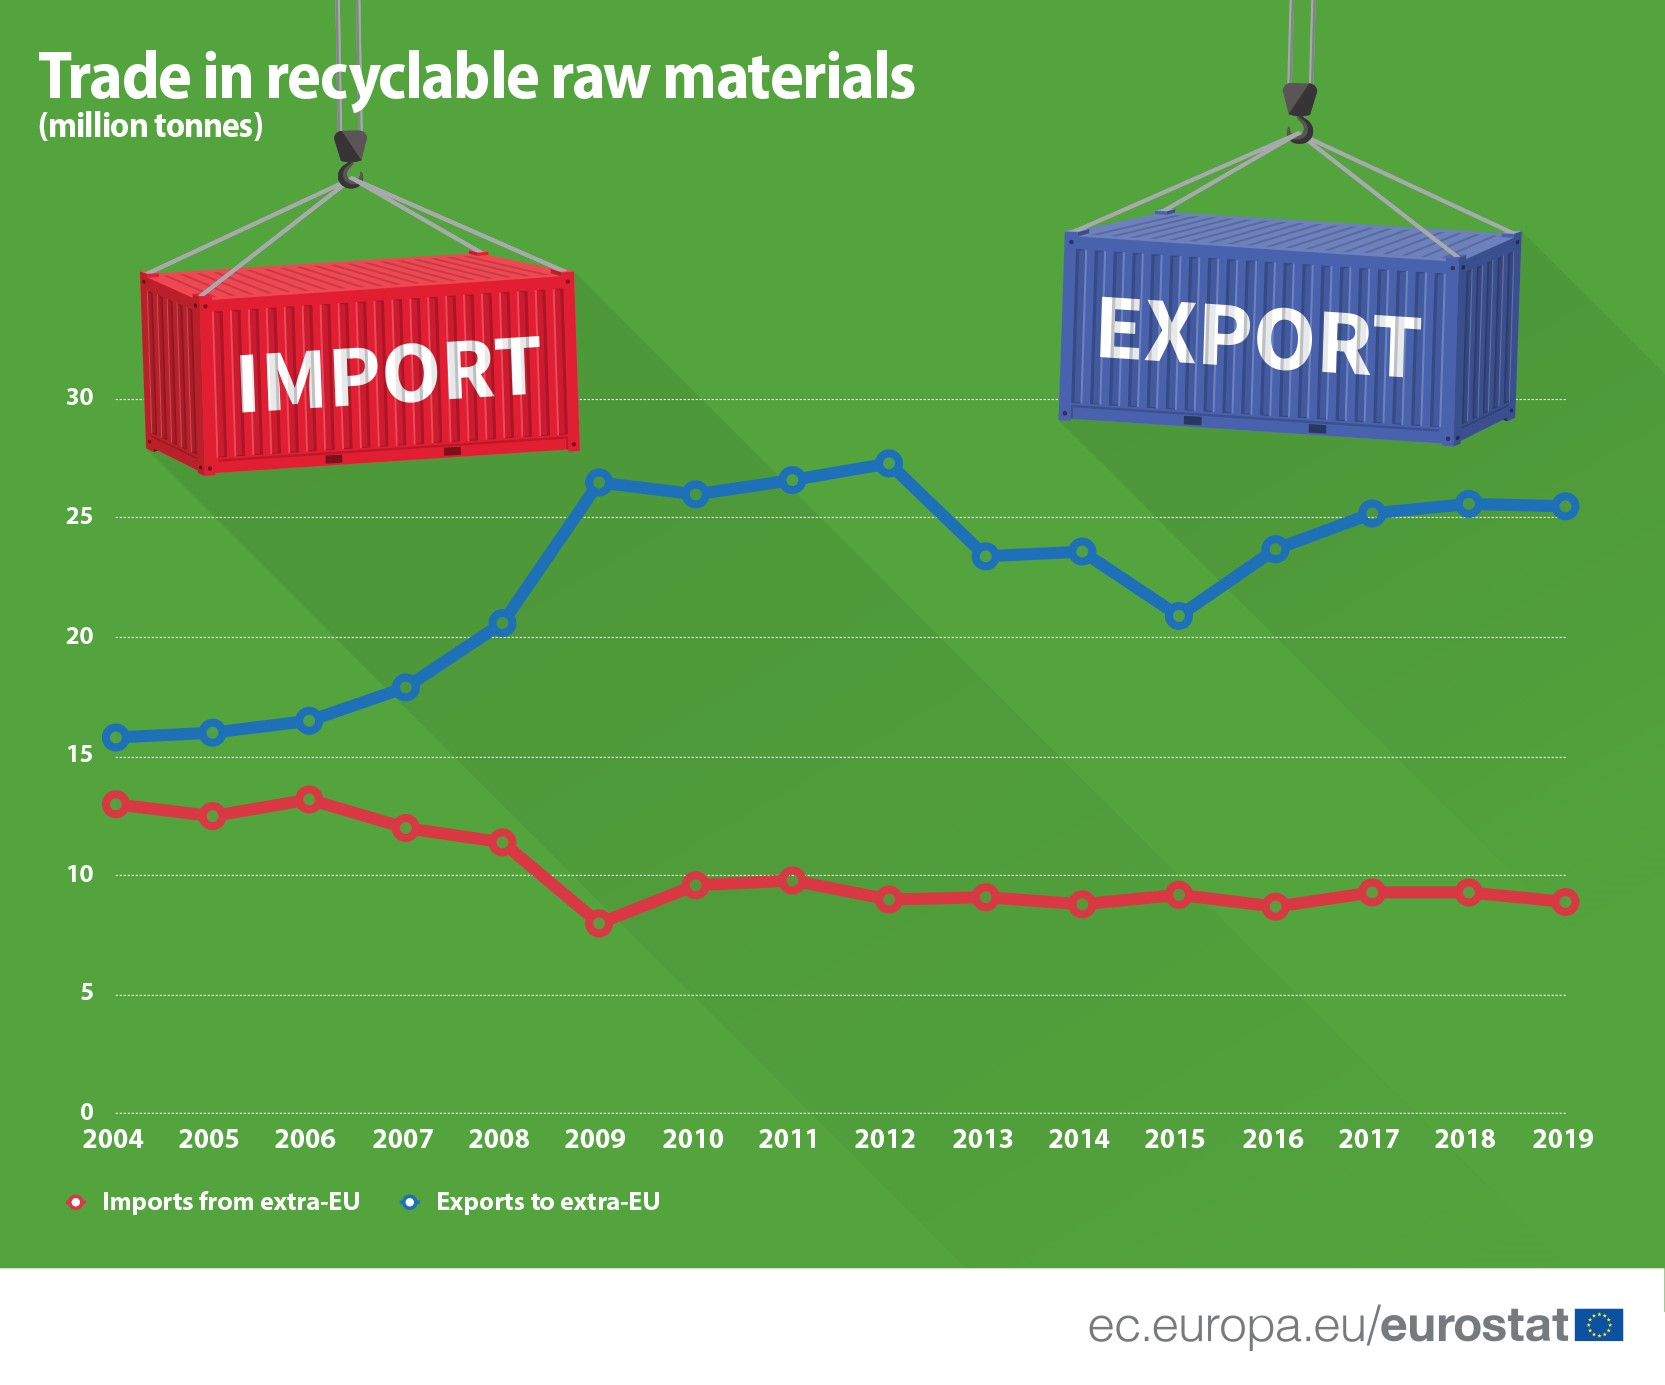
In 2019, exports of recyclable raw materials such as plastic, paper and cardboard, precious metal, iron and steel, copper, aluminium and nickel from the EU Member States to non-EU countries amounted to 25.5 million tonnes. Compared with 2004, this represents an increase of 61% (15.8 million tonnes). The volume of these exports has been on an upwards trend since 2004, reaching a peak of 27.3 million tonnes in 2012 (a 73% increase compared with 2004).
On the other hand, imports of recyclable raw materials from non-EU countries into the EU decreased between 2004 and 2019, reaching a low of 8.0 million tonnes in 2009 (a decline of about 38% compared with 2004), before rising to 8.9 million tonnes in 2019, albeit still 32% lower than in 2004.
Türkiye and India main destinations of EU exports of recyclable raw materials
Türkiyeand India were the main destinations for exports of recyclable raw materials from the EU, followed by Indonesia, China and Egypt. In 2019, Türkiye received 11.1 million tonnes of EU recyclable raw materials (up by 7% compared with 2018) and India (2.7 million tonnes, up by 9% since 2018), followed by Indonesia (1.3 million tonnes, up by 20%), China (1.2 million tonnes, down by 59%) and Egypt (1.1 million tonnes, up by 38% compared with 2018).
Most recyclable raw materials into EU from the UK, Switzerland and Norway
In 2019, EU imports of recyclable raw materials were predominantly from the United Kingdom (3.1 million tonnes, down by 13% compared with 2018), Switzerland (1.5 million tonnes, down by 2%) and Norway (1.1 million tonnes, up by 3%), followed by the United States (0.9 million tonnes, up by 21%) and Russia (0.5 million tonnes, down by 12%).

Notes:
- The scope of ‘recyclable raw materials’ is measured in terms of relevant product codes from the Combined Nomenclature used in International Trade in Goods Statistics. Five classes have been selected: plastic; paper and cardboard; precious metal; iron and steel; copper, aluminium and nickel - see list of the codes.
- The European Union (EU) includes 27 EU Member States. The United Kingdom left the European Union on 31 January 2020. Further information is published here.
To contact us, please visit our User Support page.
For press queries, please contact our Media Support.