Tutorials
Log in
Statistics Explained
menu
search
search
Navigation
Main page
Statistical themes
Glossary
Categories
Statistics 4 beginners
Tutorials
Help
Eurostat home
Education corner
Online publications
Regional yearbook
Sustainable development
Full list
Tools
User contributions
Logs
View user groups
Special pages
search
Navigation
Main page
Statistical themes
Glossary
Categories
Statistics 4 beginners
Tutorials
Help
Eurostat home
Education corner
Online publications
Regional yearbook
Sustainable development
Full list
Tools
User contributions
Logs
View user groups
Special pages
Navigation
Main page
Statistical themes
Glossary
Categories
Statistics 4 beginners
Tutorials
Help
Eurostat home
Education corner
Online publications
Regional yearbook
Sustainable development
Full list
Tools
User contributions
Logs
View user groups
Special pages
Uploads by Langver
This special page shows all uploaded files.
File list
Items per page:
20
50
100
250
500
Search for media name:
Username:
Include old versions of files
Go
First page
Previous page
Next page
Last page
Date
Name
Thumbnail
Size
Description
Versions
15:35, 9 July 2012
Foreign direct investment YB2012.xls
(
file
)
243 KB
6
12:09, 21 May 2012
Air emissions accounts YB2012.xls
(
file
)
263 KB
7
11:58, 21 May 2012
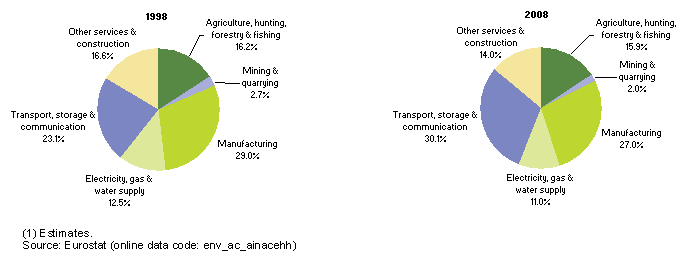
Emissions of tropospheric ozone precursors, analysis by activity, EU-27, 1998 and 2008 (1) (% of total, based on tonnes of tropospheric ozone formation potential (TOFP) equivalents).PNG
(
file
)
11 KB
1
11:44, 21 May 2012
Emissions of tropospheric ozone precursors, analysis by activity, EU-27, 1998 and 2008 (% of total, based on tonnes of tropospheric ozone formation potential (TOFP) equivalents).png
(
file
)
5 KB
1
16:40, 30 March 2012
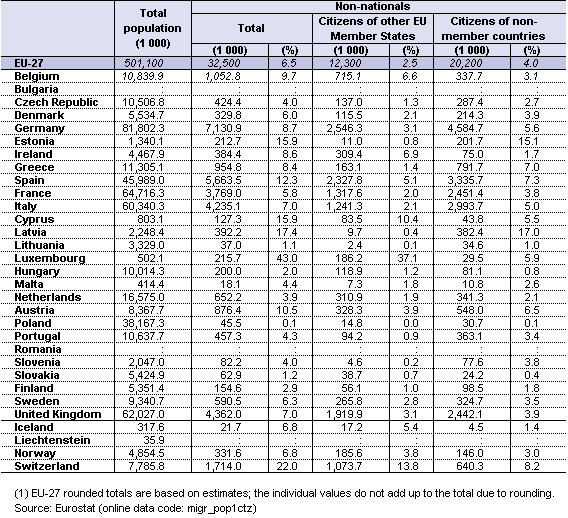
Total population and resident non-national population by group of citizenship, 2010.png
(
file
)
16 KB
4
16:32, 30 March 2012
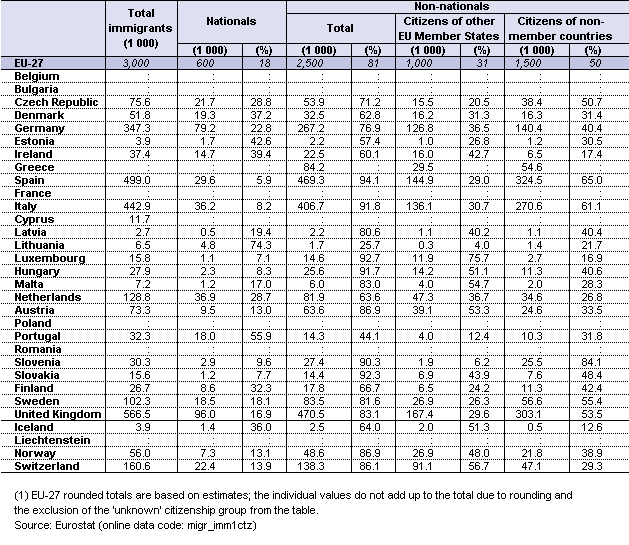
Immigration by main citizenship group, 2009.png
(
file
)
17 KB
5
10:57, 6 March 2012
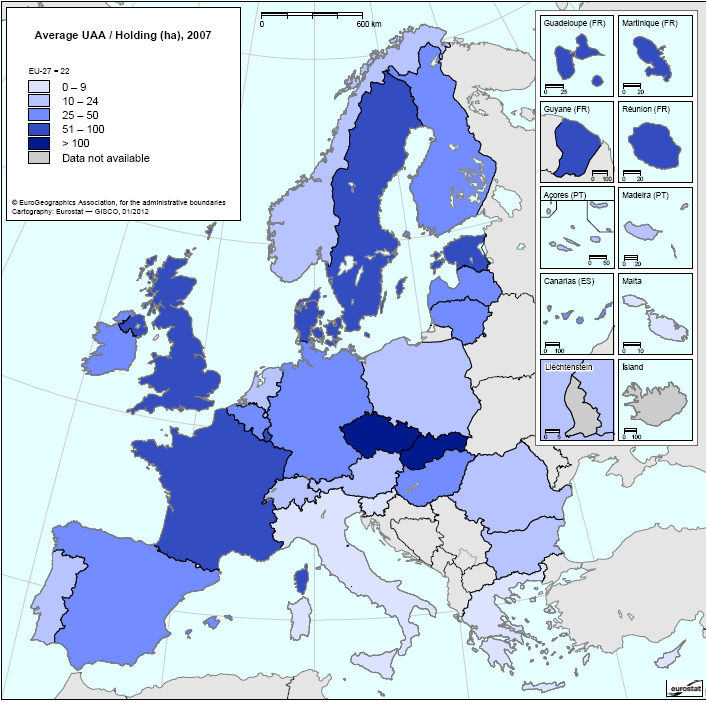
Average UAA - Holding (ha), 2007.png
(
file
)
113 KB
2
17:35, 30 January 2012
Photo Radermacher 2012.png
(
file
)
312 KB
1
15:51, 20 October 2011
Fertiliser and Nutrient Balances 2012.xls
(
file
)
122 KB
2
11:00, 18 October 2011
Number of deaths, EU-27 (1).png
(
file
)
2 KB
3
15:25, 19 August 2011
International trade in goods 2011.xls
(
file
)
298 KB
5
15:55, 21 July 2011
Farm structure 2011.xls
(
file
)
204 KB
7
11:40, 1 July 2011
Price convergence - variation coeffcient of price level indices of final household consumption expenditure.png
(
file
)
10 KB
1
17:21, 27 June 2011
Information society 2011.xls
(
file
)
420 KB
6
11:55, 27 June 2011
Tourism statistics 2011.xls
(
file
)
361 KB
6
15:32, 20 June 2011
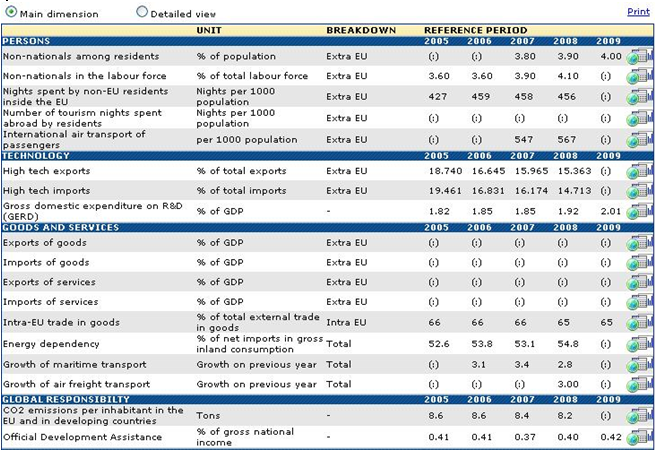
Globalisation indicator set.png
(
file
)
272 KB
1
14:27, 20 June 2011
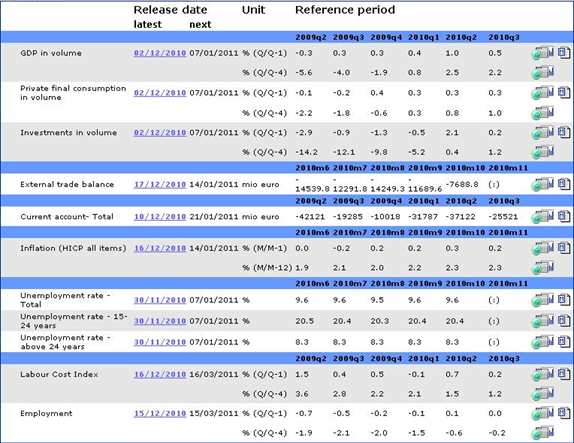
PEEIs.png
(
file
)
221 KB
1
11:21, 17 June 2011
Datacode.png
(
file
)
6 KB
1
15:01, 15 June 2011
YB2011 cover.png
(
file
)
555 KB
1
14:25, 10 June 2011
Unterschrift WR.png
(
file
)
23 KB
1
12:05, 10 June 2011
Photo foreword.png
(
file
)
171 KB
1
14:58, 7 June 2011
Structural business statistics 2011.xls
(
file
)
963 KB
3
16:08, 6 June 2011
Crime statistics 2011.xls
(
file
)
371 KB
7
15:42, 6 June 2011
Social protection statistics 2011.xls
(
file
)
98 KB
6
10:43, 1 June 2011
Labour market policy interventions 2011.xls
(
file
)
96 KB
4
11:07, 30 May 2011
Unemployment trends 2011.xls
(
file
)
104 KB
5
14:47, 24 May 2011
Lifelong learning 2011.xls
(
file
)
57 KB
3
15:15, 17 May 2011
Healthcare statistics 2011.xls
(
file
)
500 KB
9
14:48, 16 May 2011
Death from suicide - standardised death rate, 2008 (1) per 100 000 inhabitants).png
(
file
)
10 KB
1
15:49, 13 May 2011
Migration and migrant population statistics 2011.xls
(
file
)
235 KB
9
11:26, 12 May 2011
Population and population change 2011.xls
(
file
)
147 KB
4
18:03, 5 May 2011
European population compared with other regions of the world 2011.xls
(
file
)
142 KB
4
15:47, 19 April 2011
Foreign direct investment 2011.xls
(
file
)
136 KB
7
16:20, 11 April 2011
Exchange rates and interest rates 2011.xls
(
file
)
216 KB
5
18:37, 7 April 2011
Balance of payments - current and financial accounts 2011.xls
(
file
)
214 KB
5
12:18, 6 April 2011
National accounts 2011.xls
(
file
)
794 KB
10
17:26, 5 April 2011
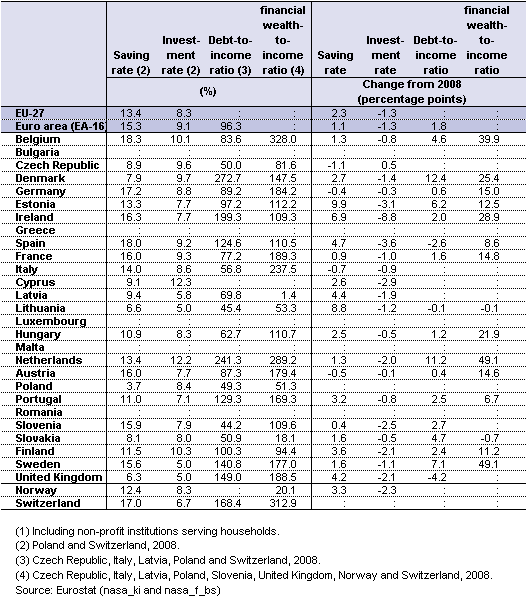
Key ratios of sector accounts, households, 2009.png
(
file
)
14 KB
1
11:51, 5 April 2011
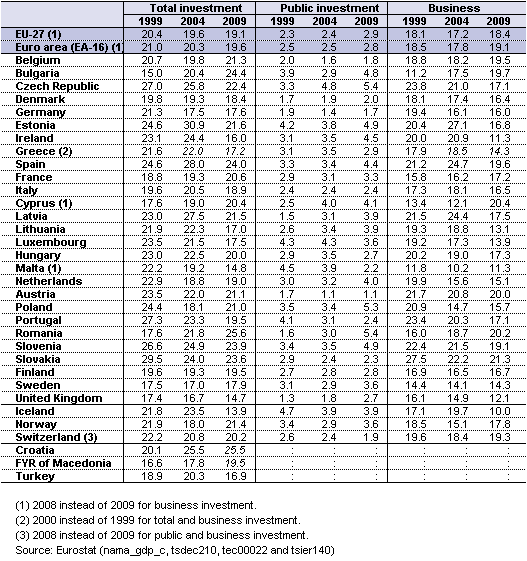
Investment (% share of GDP).png
(
file
)
16 KB
3
09:24, 4 April 2011
Agricultural output, price indices and income 2011.xls
(
file
)
73 KB
6
11:46, 1 April 2011
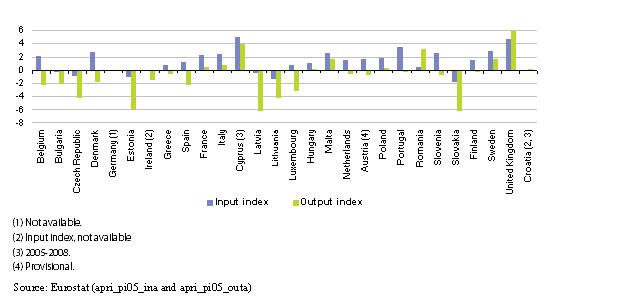
Change in deflated price indices of agricultural input and output, 2005-2009.jpg
(
file
)
28 KB
1
17:21, 24 January 2011
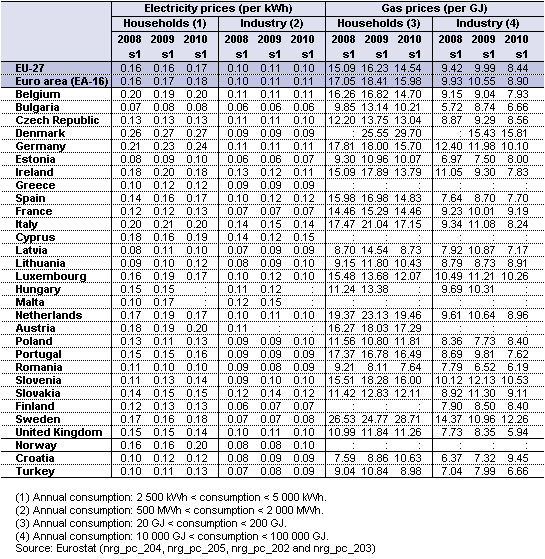
Half-yearly electricity and gas prices (EUR) updated.png
(
file
)
17 KB
1
16:58, 24 January 2011
Energy prices updated 2011.xls
(
file
)
75 KB
2
15:56, 14 December 2010
Consumer prices - inflation and comparative price levels, 2011.xls
(
file
)
93 KB
1
15:30, 14 December 2010
Consumer prices - inflation and comparative price levels.xls
(
file
)
93 KB
1
13:26, 14 December 2010
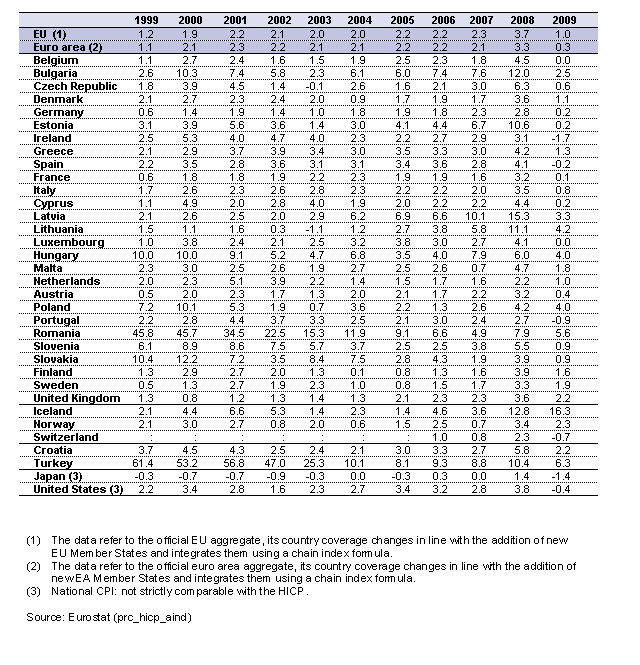
HICP all-items, annual average inflation rates, 1999-2009 (%).png
(
file
)
33 KB
1
12:14, 7 December 2010
Living conditions (2) 2011.xls
(
file
)
311 KB
1
11:56, 7 December 2010
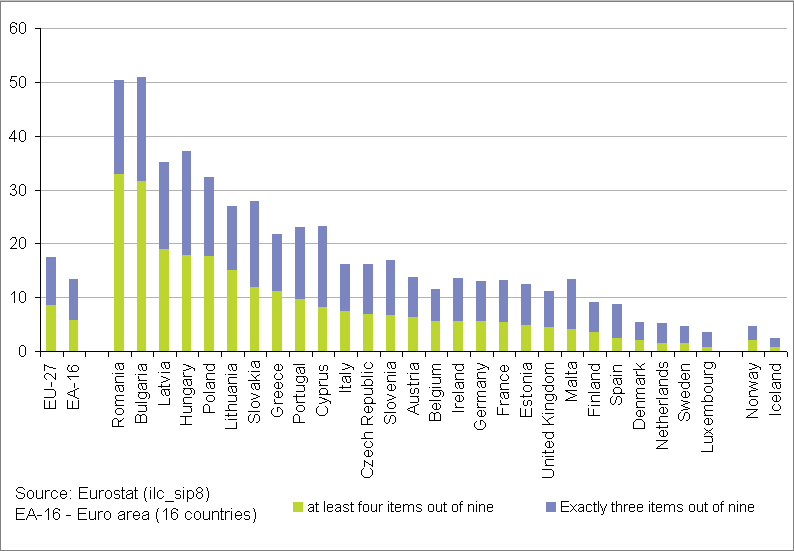
Material deprivation rate - economic strain and durables dimension (%), 2008.png
(
file
)
9 KB
1
12:07, 3 December 2010
Living conditions statistics 2011.xls
(
file
)
318 KB
2
17:14, 29 November 2010
Information society statistics 2011.xls
(
file
)
377 KB
1
16:23, 26 November 2010
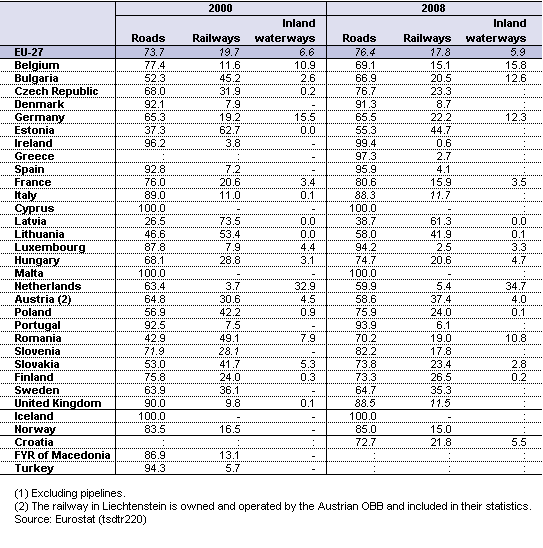
Modal split of inland freight transport, 2000 and 2008.png
(
file
)
12 KB
1
First page
Previous page
Next page
Last page
Special page
ISSN 2443-8219
_(%25_of_total,_based_on_tonnes_of_tropospheric_ozone_formation_potential_(TOFP)_equivalents).PNG)
_equivalents).png)


,_2007.png)

.png)


_per_100_000_inhabitants).png)

.png)

_updated.png)
.png)
,_2008.png)
