European Statistical Recovery Dashboard: May edition

Today, Eurostat released the May edition of the interactive European Statistical Recovery Dashboard.
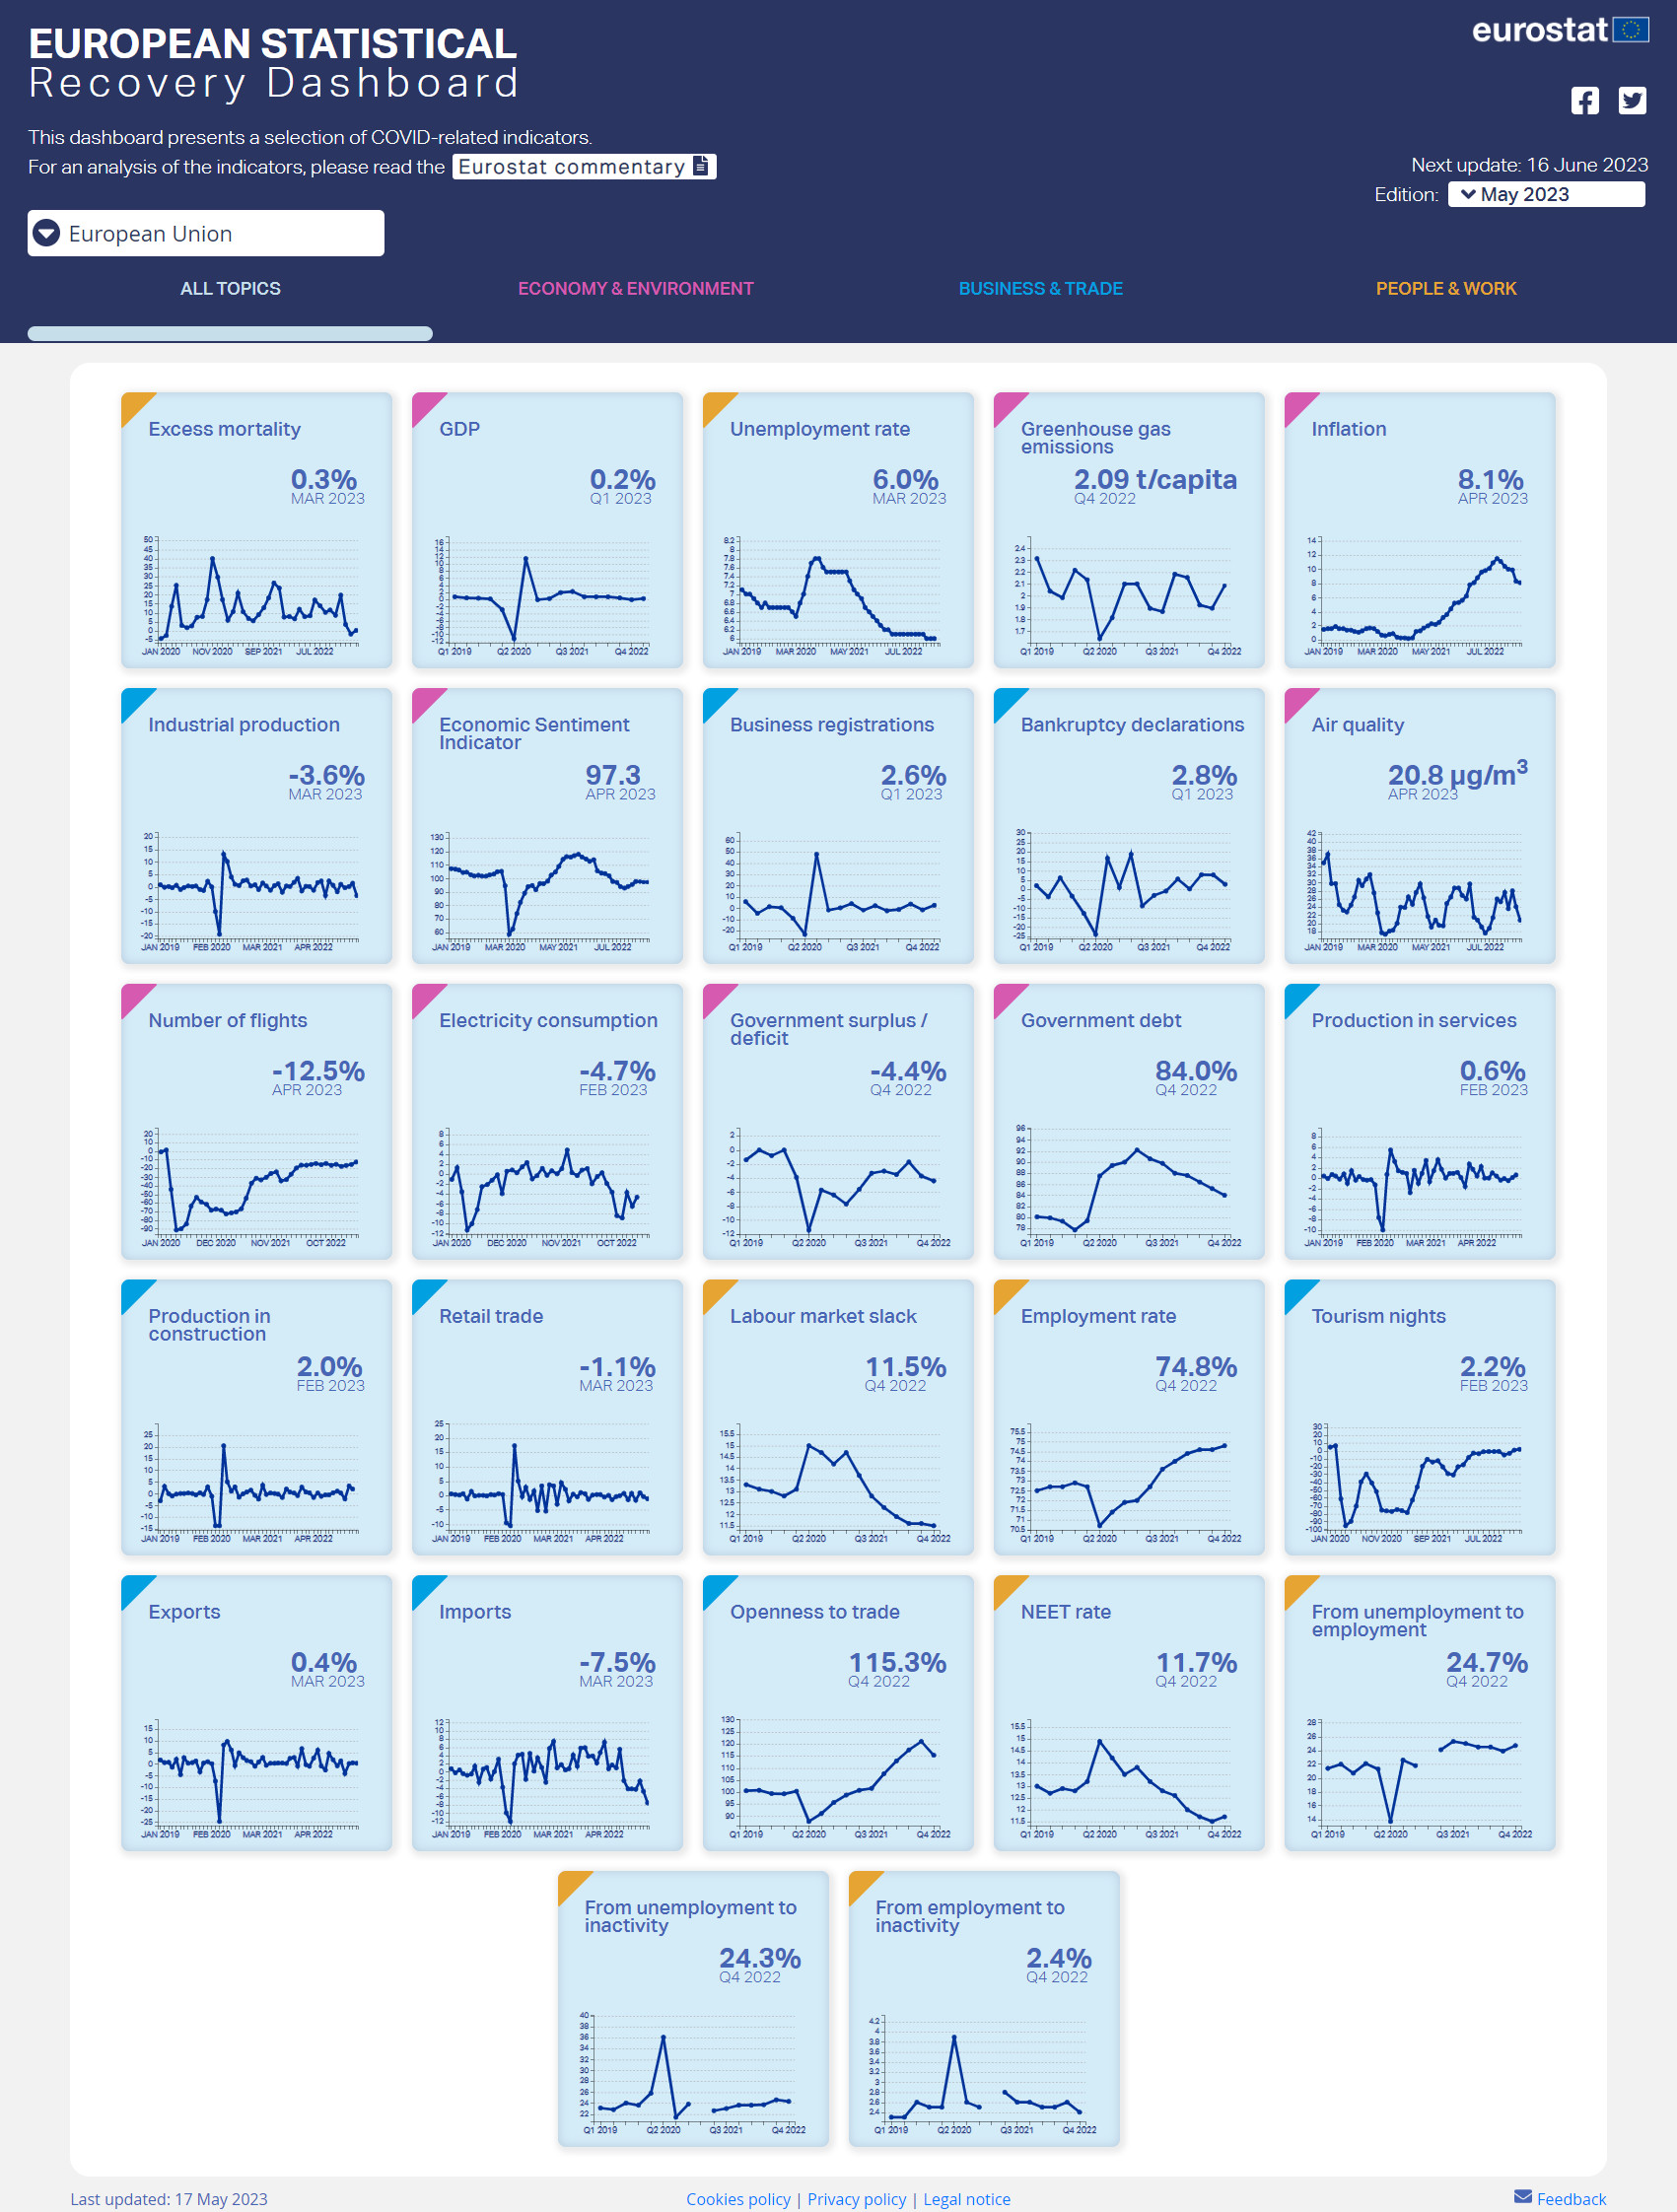
The dashboard contains monthly and quarterly indicators from a number of statistical areas relevant to tracking the economic and social recovery from the COVID-19 pandemic, across countries and time.
May highlights: the EU economy returns to growth and inflation continues to fall, while industrial production drops
The EU economy regained momentum in Q1 2023, with output expanding on a quarter-on-quarter basis. Following a slight contraction in the previous quarter, this positive development confirms that the EU successfully avoided a winter recession. As an indication of its resilience and recovery, EU gross domestic product (GDP) further exceeded its pre-pandemic level from Q4 2019.
However, a more nuanced view of the EU's economic landscape emerges at sectoral level. Both industrial production and retail trade exhibited a volatile month-on-month growth trajectory in the first three months of the year, albeit still surpassing pre-pandemic levels. In March 2023, industrial production experienced a month-on-month decline, negating the gains made in January and February.
Meanwhile, retail trade saw downturns in February and March, counterbalancing a rise in January. While a comprehensive view of the services sector remains incomplete due to data availability only until February, the sector had a second consecutive month of growth in February 2023, continuing to outperform pre-pandemic levels.
The inflation rate fell for the sixth straight month in April 2023, and the unemployment rate remained stable in March at historically low levels, reinforcing the positive economic landscape for the EU in the first quarter of the year. Furthermore, the EU as a whole had a near-zero excess mortality rate in March 2023.
You can read the full analysis by clicking “Eurostat commentary” on the dashboard’s header. The dashboard is updated every month with the latest available data for each indicator.
The line charts in the dashboard offer many functionalities to easily explore and analyse the development of the indicators, such as displaying a longer time series, comparing several countries and downloading the customised chart or the source dataset.
For more information
- Statistics Explained article on Eurostatistics - data for short-term economic analysis
- Thematic section on COVID-19
If you have any queries, please visit our contact us page.

