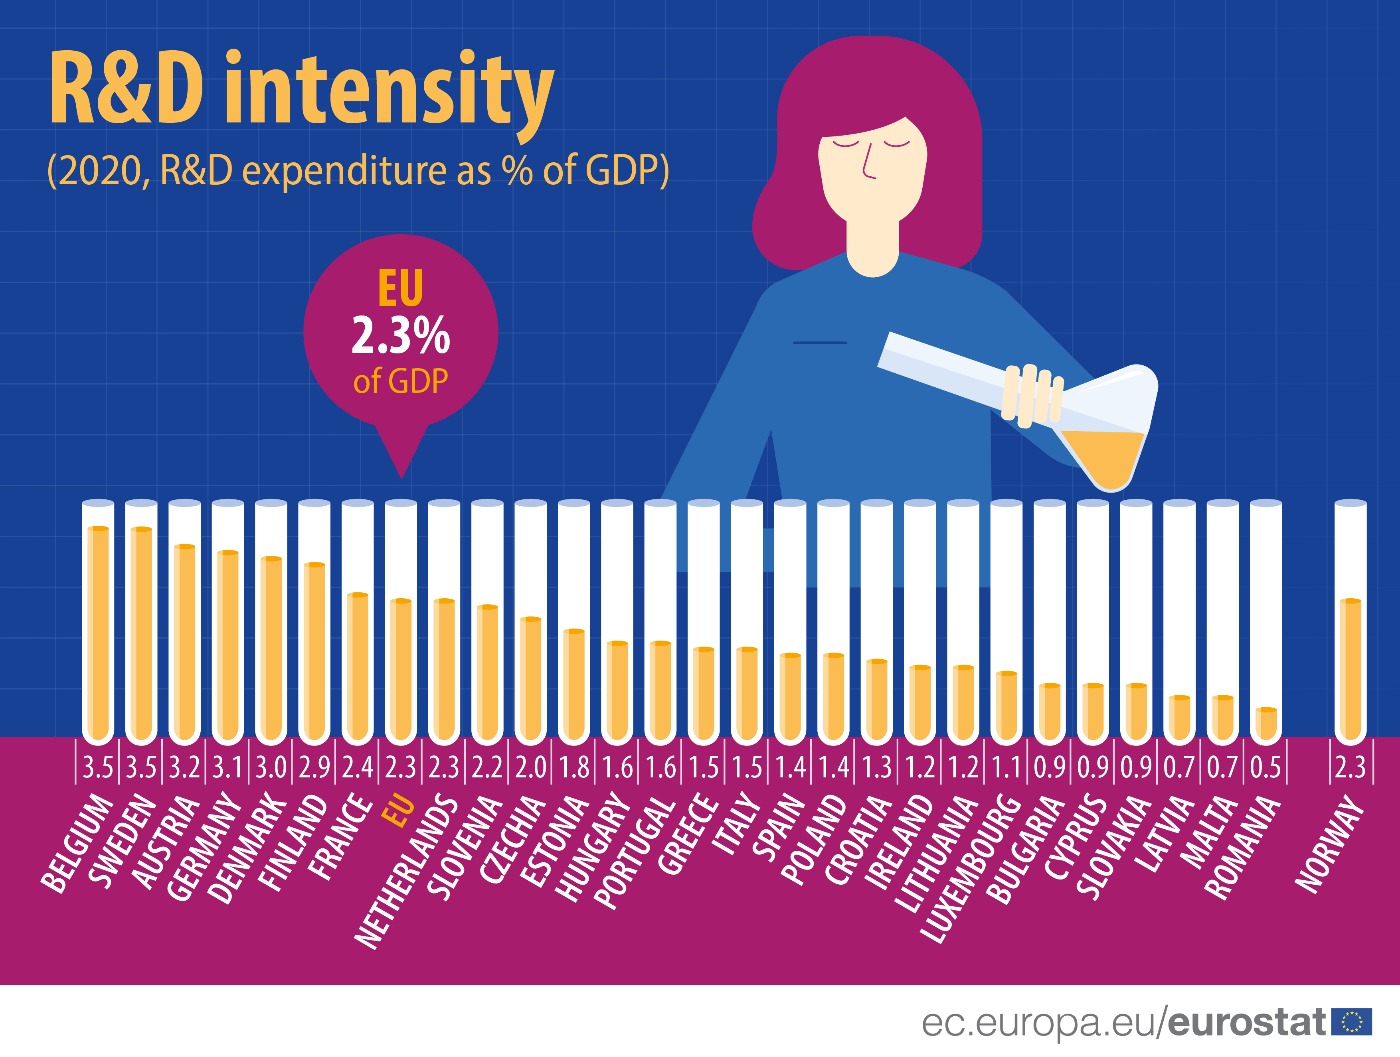
In 2020, the Member States of the EU spent around €311 billion on research & development (R&D). This is a decrease of €1 billion compared with 2019 (€312 billion). The R&D intensity, i.e. R&D expenditure as a percentage of GDP, stood at 2.3% in 2020, compared with 2.2% in 2019. However, this small increase is due to a decrease in GDP as a result of the COVID-19 pandemic. Ten years earlier (2010), R&D intensity was 2.0%.
R&D is a major driver of innovation, and R&D expenditure and intensity are two of the key indicators used to monitor resources devoted to science and technology worldwide.
The business enterprise sector continues to be the main sector in which R&D expenditure was spent, accounting for 66% of total R&D disbursed in 2020, followed by the higher education sector (22%), the government sector (12%) and the private non-profit sector (1%; data might not add up to 100% due to rounding).
This information comes from data on R&D expenditure published by Eurostat today.
Highest R&D intensity at 3.5% recorded in Belgium and Sweden
In 2020, the highest R&D intensity was recorded in Belgium and Sweden (3.5% of GDP), followed by Austria (3.2%) and Germany (3.1%).
At the opposite end of the scale, six Member States recorded a R&D intensity below 1% of GDP: Romania (0.5%), Malta and Latvia (both 0.7%), Cyprus, Bulgaria and Slovakia (all 0.9%).
Source dataset: rd_e_gerdtot
Over the last ten years, R&D intensity rose in 24 Member States, with the highest increase recorded in Belgium (+1.5 percentage points; from 2.0% of GDP in 2010 to 3.5% in 2020), Greece (+0.9 pp; from 0.6% to 1.5%), Poland and Czechia (both +0.7 pp; from 0.7% to 1.4% and from 1.3% to 2.0%, respectively).
In contrast, R&D intensity decreased in three Member States; Finland (-0.8 pp; from 3.7% to 2.9%), Ireland and Luxembourg (both -0.4 pp; from 1.6% to 1.2% and from 1.5% to 1.1%, respectively).
For more information:
- 2020 data on R&D expenditure presented in this article are preliminary and might therefore be revised. Following the calendar for the transmission of data, updated figures will be published in March and November 2022.
- Eurostat website section dedicated to science, technology and innovation
- Eurostat database section dedicated to science, technology and innovation
To contact us, please visit our User Support page.
For press queries, please contact our Media Support.


