© GH Studio/Shutterstock.com
European Statistical Monitor: June edition
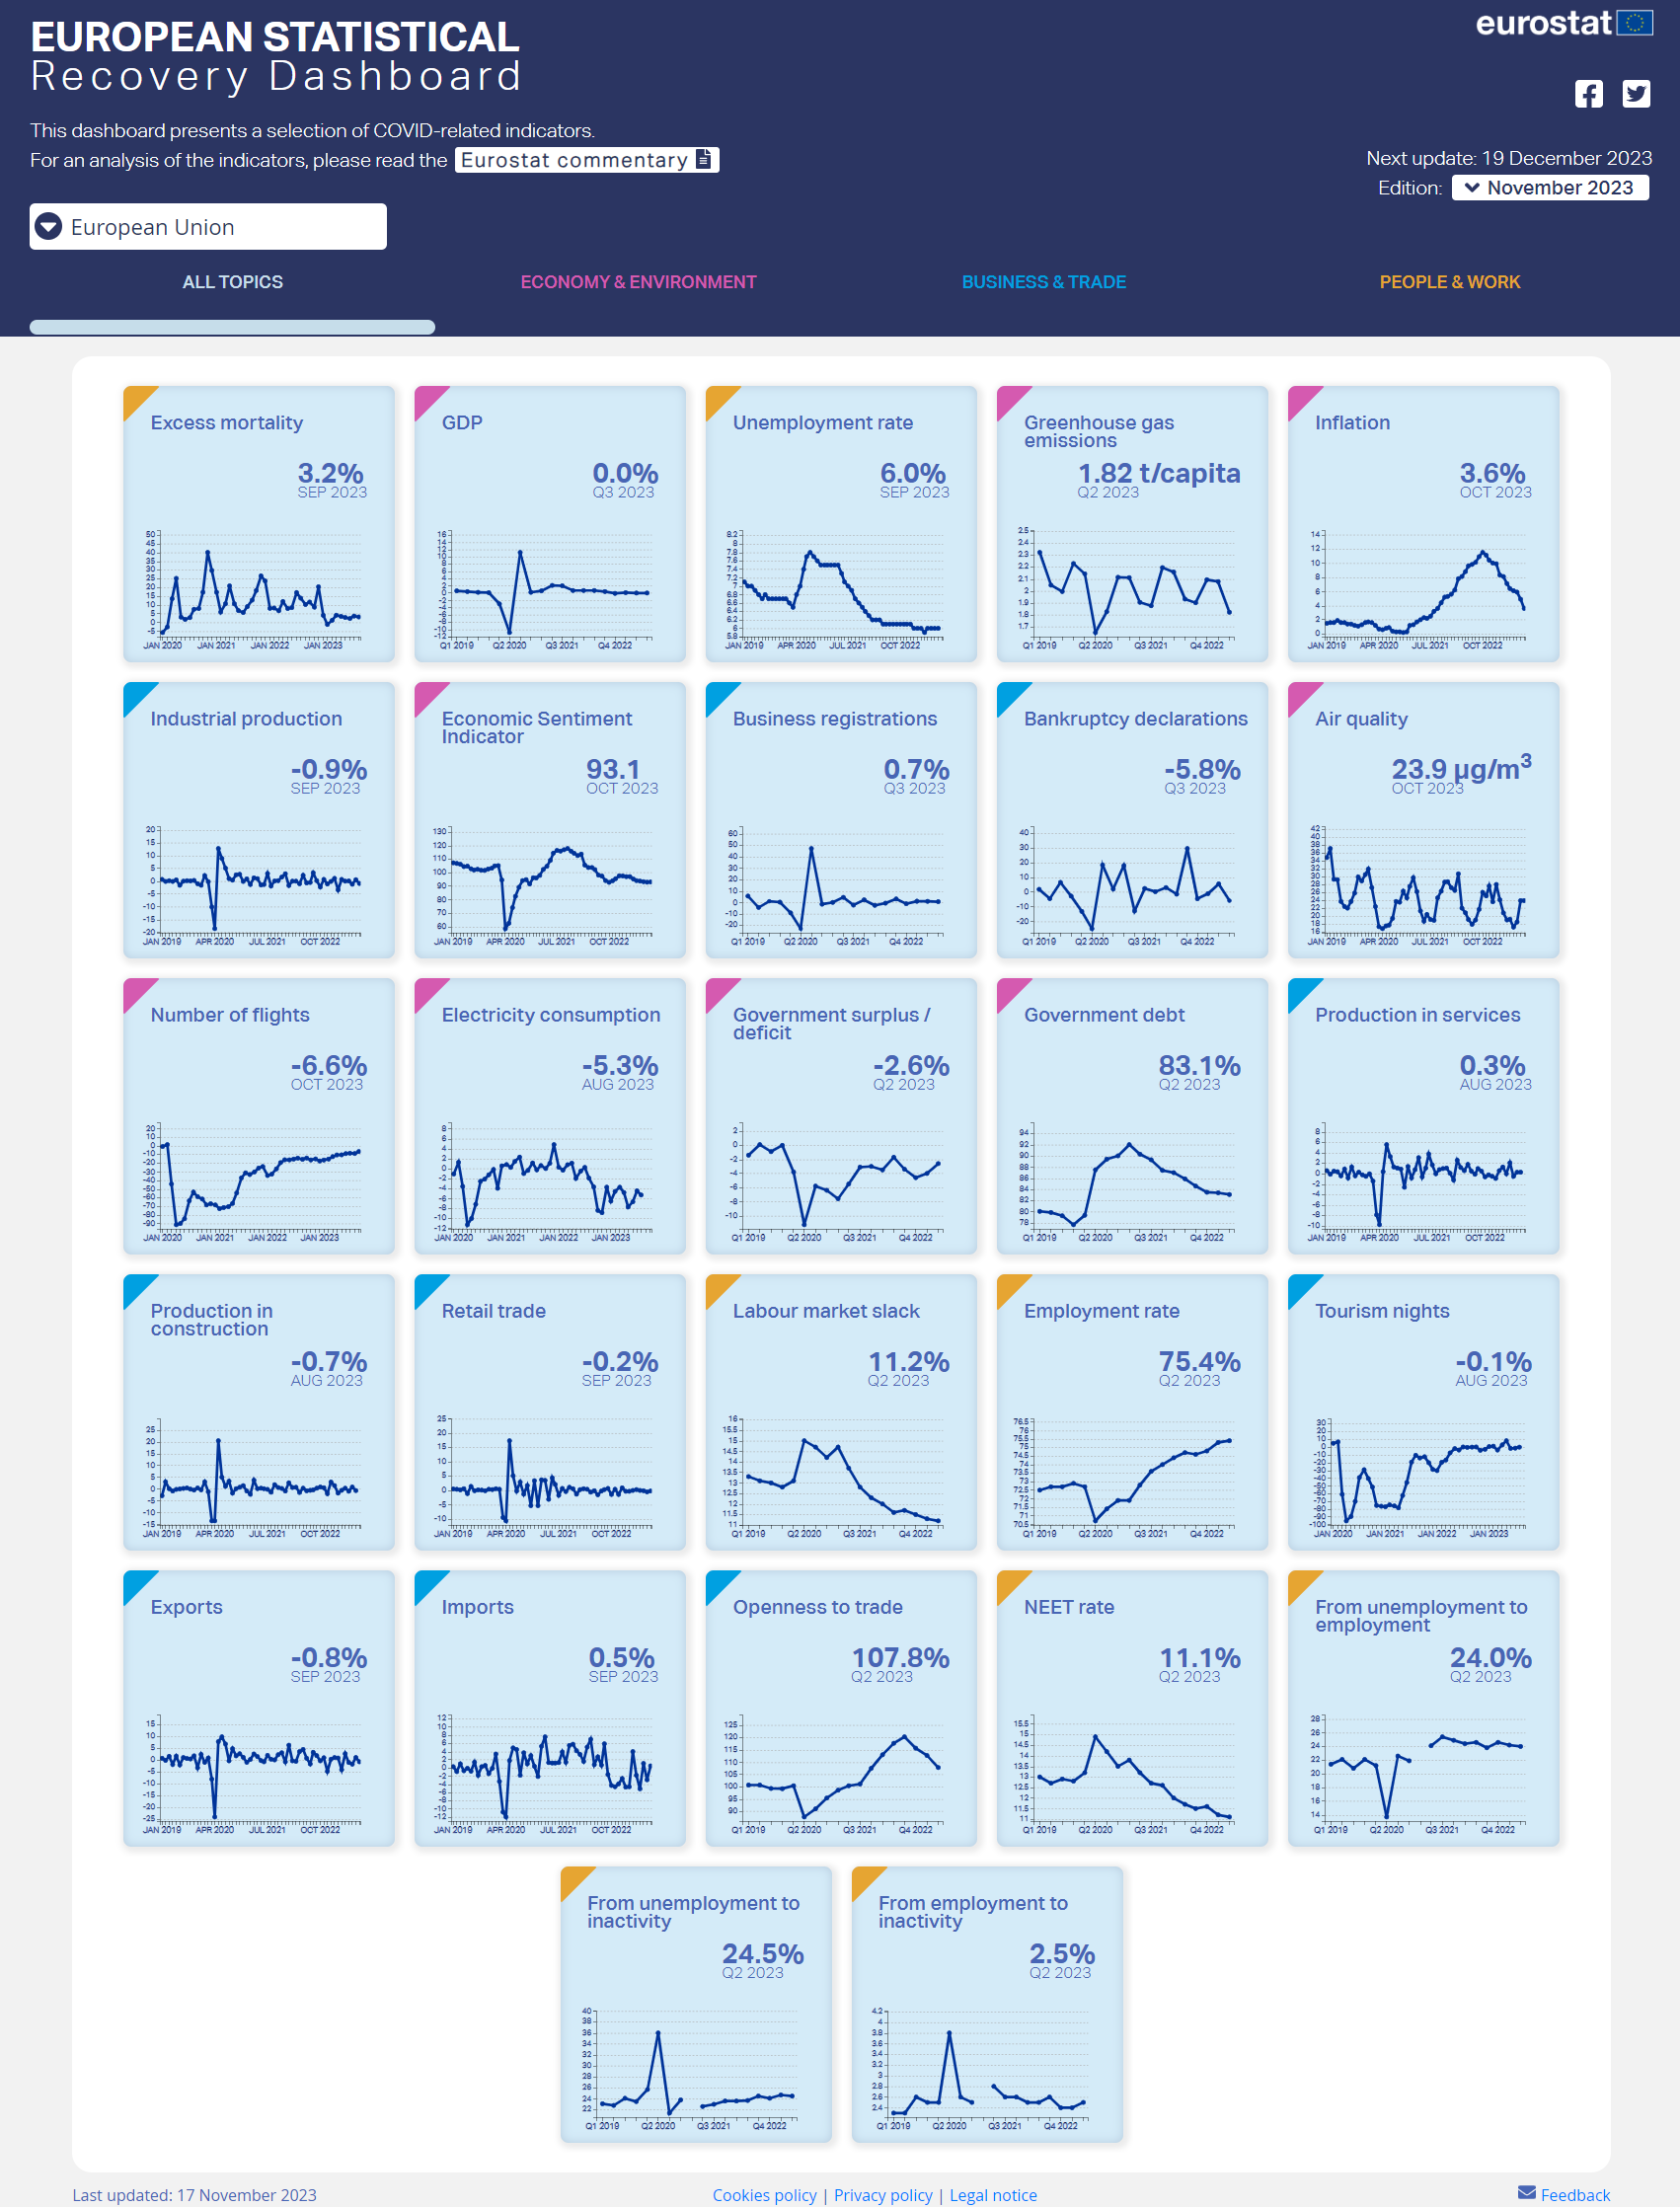
Today, Eurostat released the November edition of the interactive European Statistical Recovery Dashboard.
The dashboard contains monthly and quarterly indicators from a number of statistical areas relevant to tracking the economic and social recovery from the COVID-19 pandemic, across countries and time.
November highlights: EU GDP remains stable amid diverse sectoral evolution and continued falls in greenhouse gas emissions
EU gross domestic product (GDP) remained stable in Q3 2023 compared to the previous quarter, marking the second consecutive quarter of unchanged economic output for the EU (see Figure 1). Although GDP stayed above its pre-pandemic levels, the figures for the last four quarters indicate a flat growth trend. However, a closer look at monthly macroeconomic indicators reveals more varied dynamics across different sectors.
EU industrial production declined month-on-month in September 2023, reversing the rise observed in August. Although production output stayed above its pre-pandemic level, its trend shows a rather downward trajectory in terms of growth.
In September 2023, EU retail trade declined for the third consecutive month, yet it remained above its pre-pandemic level. The sector has exhibited subdued momentum over an extended period, likely influenced by the persistent effects of high inflation in the EU. Even though overall inflation fell further in October 2023 to its lowest level for two years, primarily due to falling energy prices, some main component rates remained relatively high.
In contrast, the service sector painted a more positive picture. In August 2023, EU production in services marked the second consecutive month of growth, reaching a new historic high and indicating an upward growth trend.
The EU labour market continued its robust performance in September 2023, with the unemployment rate remaining around its historically low rate.
In Q2 2023, the EU continued to record a notable reduction in greenhouse gas emissions compared to pre-pandemic levels.
You can read the full analysis by clicking ‘Eurostat commentary’ on the dashboard’s header.
The dashboard is updated every month with the latest available data for each indicator.
The line charts in the dashboard offer many functionalities to easily explore and analyse the development of the indicators, such as displaying a longer time series, comparing several countries and downloading the customised chart or the source dataset.
If you have any queries, please visit our contact us page.