Today, Eurostat released the September edition of the interactive European Statistical Recovery Dashboard.
The dashboard contains monthly and quarterly indicators from a number of statistical areas relevant for tracking the economic and social recovery from the COVID-19 pandemic, across countries and time.
In recent months, a number of additions have been introduced into the dashboard to better track the recovery and to meet needs expressed by users.
A quarterly index of bankruptcy declarations and a quarterly index of registrations of new businesses have been added, improving the monitoring of business demography. An air quality indicator has also been added, which covers an aspect of the environmental impact of the recovery, by measuring the monthly average of NO2 concentration in European capital cities.
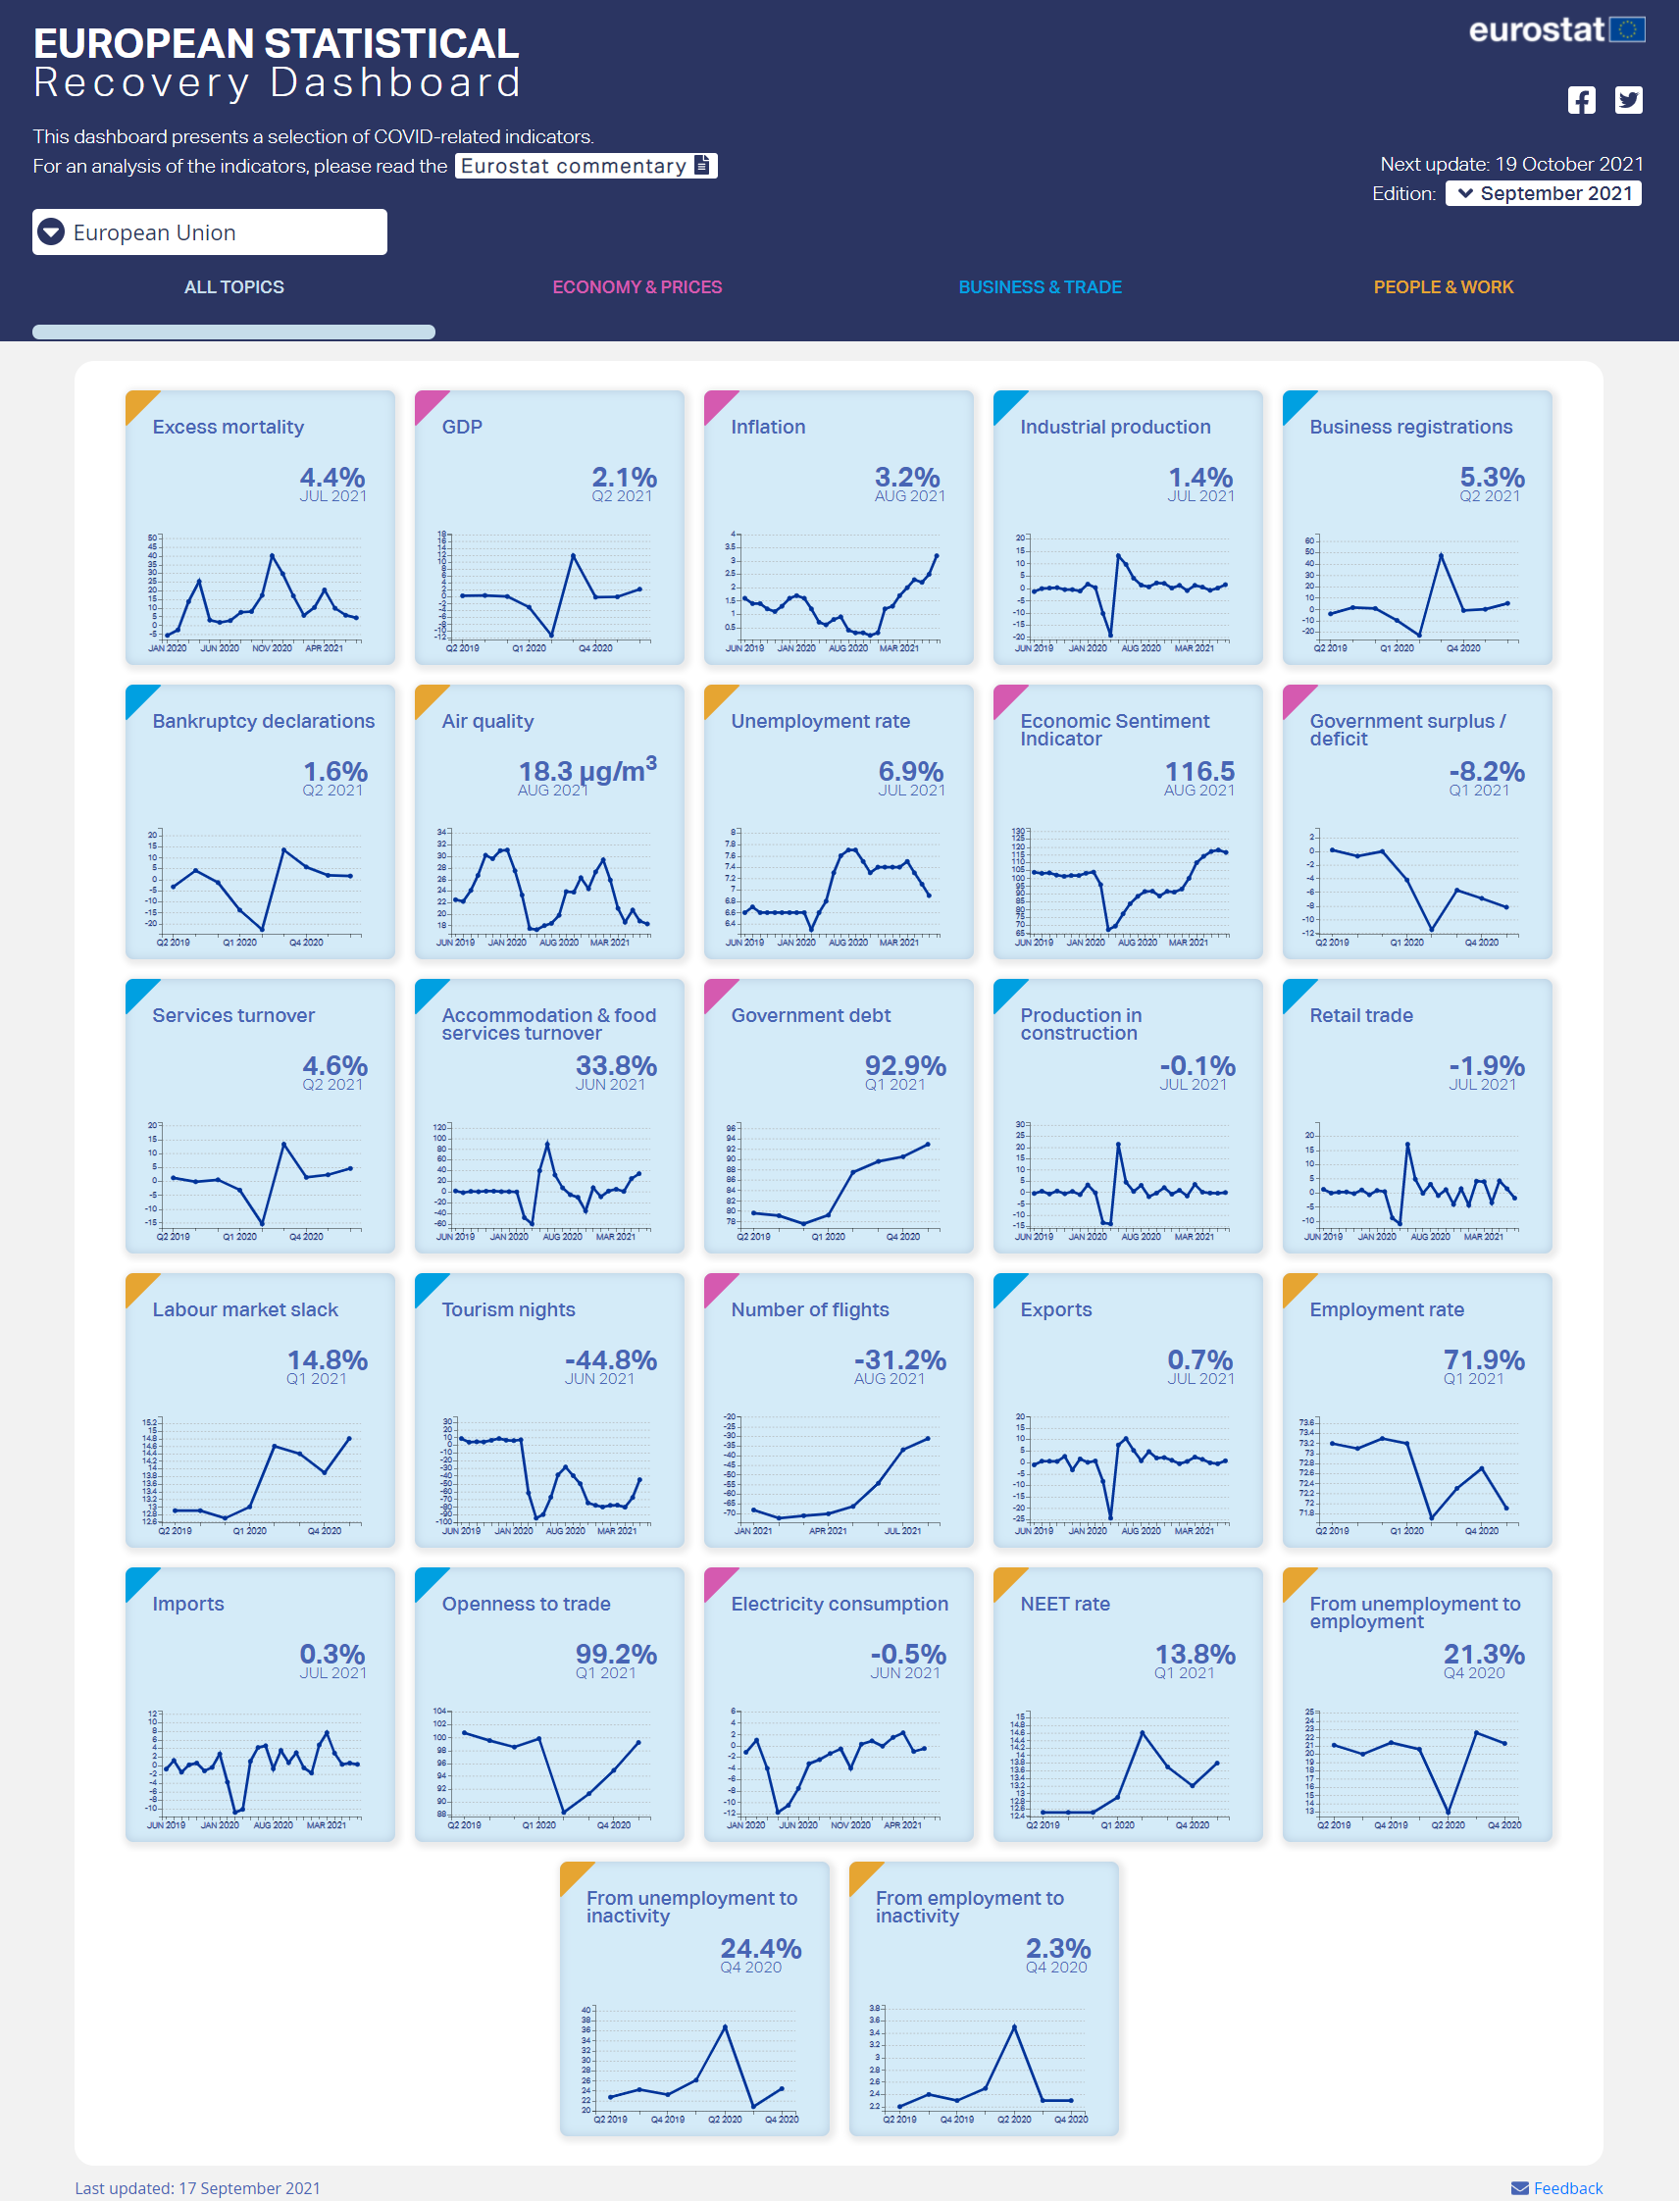
The monthly Eurostat commentary, which accompanies the dashboard, has been enhanced, with graphical analysis focusing on the evolution of key indicators since the start of the pandemic, and a summary table highlighting the indicators that are at, or beyond, pre-pandemic levels.
Exploring and analysing the development of the indicators is now easier: users can choose longer time series comparing several countries, and can download a customised chart or the source dataset.
The dashboard is updated every month with the latest available data for each indicator.
For more information, you can visit our website section dedicated to COVID-19, bringing together in one place a wide range of statistics published by Eurostat.
To contact us, please visit our User Support page.
For press queries, please contact our Media Support.