Trade in medicinal & pharma products: new peak in 2022

Between 2002 and 2022, EU exports of medicinal and pharmaceutical products to countries outside the EU grew considerably stronger than imports.
Exports increased from €50 billion in 2002 to €287 billion in 2022. Compared with 2021 (€235 billion), the 2022 total represented an increase of 22%. Imports rose from €32 billion to €112 billion between 2002 to 2022, rising almost 12% from 2021 (€100 billion) to 2022.
With extra-EU exports growing more than imports, the EU’s trade surplus in medicinal and pharmaceutical products reached €175 billion, the highest value since 2002 (€18 billion).
Source dataset: ds-018995
Largest exporters and importers were Germany and Belgium
In 2022, Germany was the EU’s largest extra-EU exporter (€68 billion), followed by Belgium (€56 billion), Ireland (€42 billion), the Netherlands and Italy (each €22 billion).
The largest extra-EU importers of medicinal and pharmaceutical products were Belgium (€21 billion), followed by Germany (€19 billion), the Netherlands (€18 billion), Spain (€10 billion) and Italy (€9 billion).
USA and Switzerland remained main EU trade partners
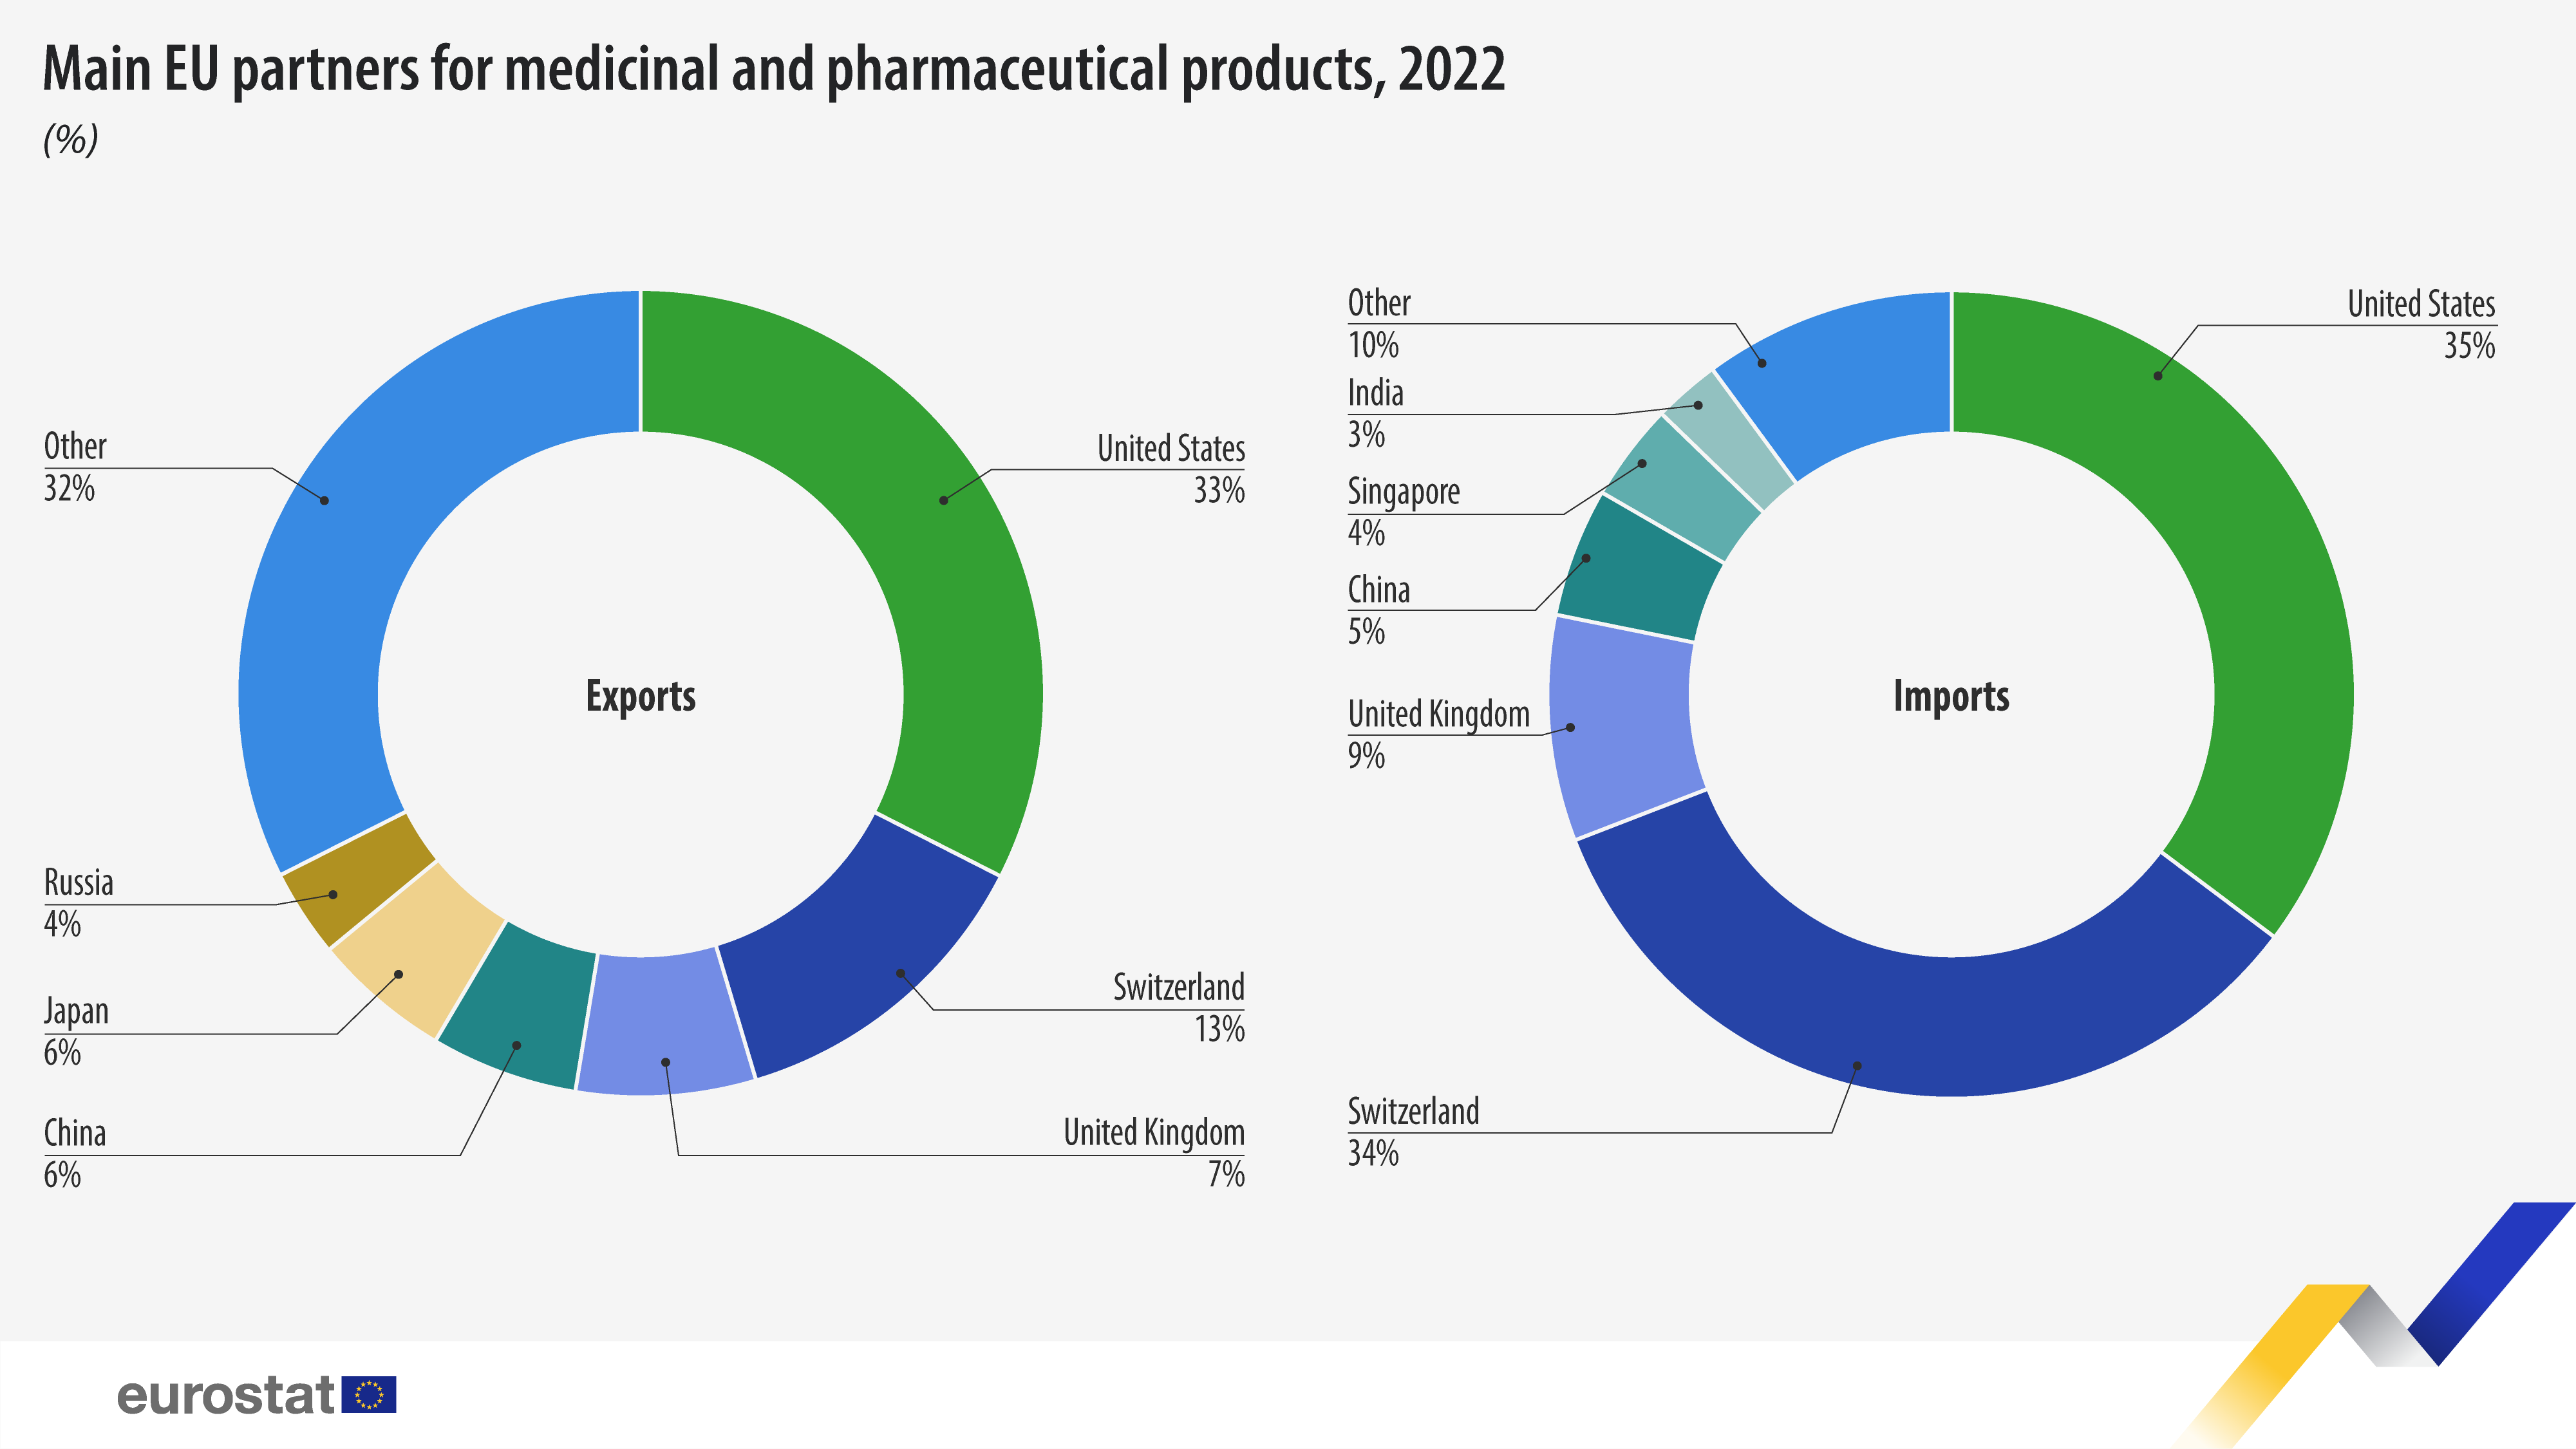
The main destination of extra-EU exports of medicinal and pharmaceutical products in 2022 was the United States, accounting for almost a third (33%) of these exports, followed at a distance by Switzerland (13%), the United Kingdom (7%), China and Japan (both 6%).
Imports of these products to the EU came mainly from the United States, accounting for 35% of all EU imports of these products, then Switzerland (34%), United Kingdom (9%) followed by China (5%) and Singapore (4%).
Source dataset: ds-018995
Regarding trade between the EU and the United States, between 2002 and 2022, EU exports of medicinal and pharmaceutical products grew by more than 9% per year, and EU imports grew by almost 7% per year. During this period, the trade balance has been in favour of the EU, registering a surplus of €54 billion in 2022.
As for Switzerland, between 2002 and 2022, EU exports grew by almost 10% per year, and imports grew by almost 8% per year. Over the same period, the EU had a trade deficit that totalled -€8 billion in 2009, 2012, 2019 and -€9 billion in 2021. In 2022, a reduction in this deficit was recorded, with the trade balance reported as -€1 billion.
For more information
- Statistics Explained article on international trade in medicinal and pharmaceutical products
- Thematic section on international trade in goods
- Database on international trade in goods
Methodological note:
- As of January 2021 onwards, data on trade with the United Kingdom is based on a mixed concept. In application of the Withdrawal Agreement Protocol on Ireland / Northern Ireland, for trade with Northern Ireland the statistical concepts applicable are the same as those for trade between Member States while for trade with the United Kingdom (excluding Northern Ireland) the same statistical concepts are applicable as for trade with any other extra-EU partner country. For these reasons, data on trade with the United Kingdom are not fully comparable with data on trade with other extra-EU trade partners, and for reference periods before and after the end of 2020.
If you have any queries, please visit our contact us page.


