
A new version of the Eurostat data browser, featuring improved functionalities, is now available online.
The data browser is a tool for displaying, charting and downloading statistical data in an easy and interactive way. The main functionalities are filtering of dimensions, saving customized views, contextual help and extended range of download formats.
What are the new features?
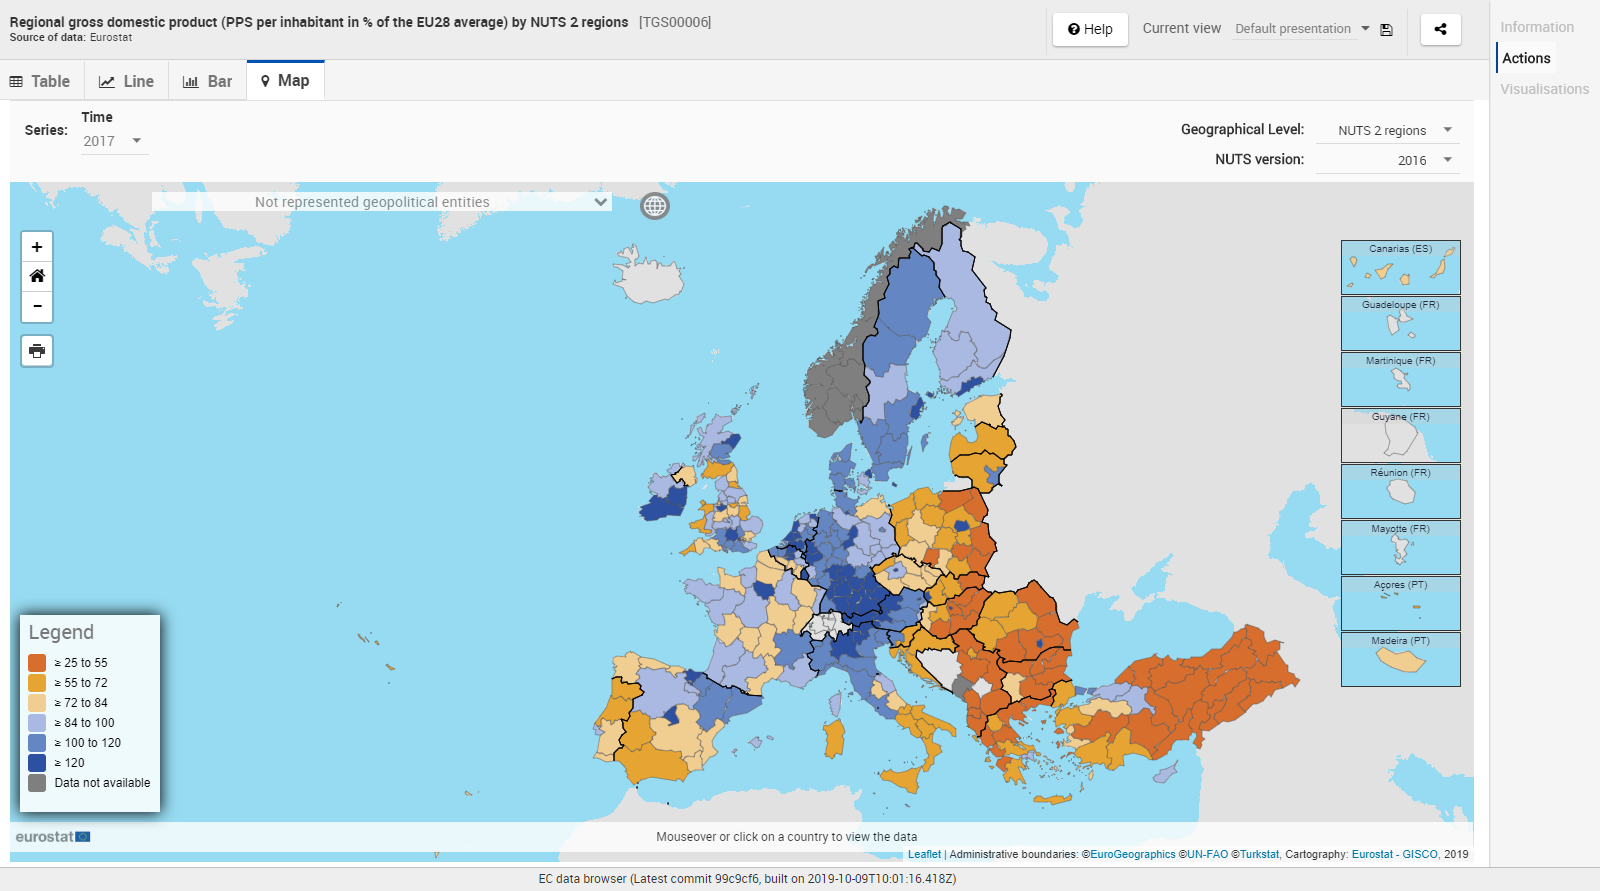
- Map visualisation now uses the NUTS 2016 boundaries by default
- New NUTS version switcher which allow users to select the NUTS version in the Map visualisation
- Improvements to the Maps visuals
- Improved data display mode allowing users to use the ‘Summary’ or ‘Highlighted’ mode in different visualisations
Where can I find the data browser?
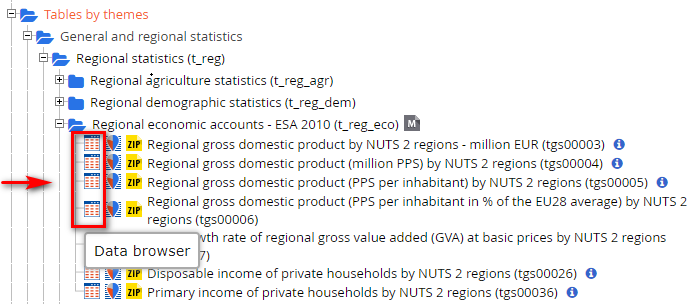
The updated beta version of the tool is offered in parallel with the interface Tables, Graphs and Maps for “tables by themes” and “tables on EU policy” in the Eurostat navigation tree. Click on this icon  to access the new data browser:
Try the data browser and give us your feedback on our user support page.
Thanks for helping us to improve our products!