
The majority of the food that people eat and beverages that people drink has followed a chain that extends from the raw agricultural and fisheries products produced on farms, and from the fish caught at sea, through to what is on our plates or in our glasses.
Eurostat has just published a Statistics Explained article, which sheds a statistical light on the key stages that make up this chain. It helps understand the chain that is at the centre of the European Commission’s new Farm to Fork strategy within the new European Green Deal.
The Statistics Explained article provides insight to important elements of the Farm to Fork chain:
- on ‘ensuring stable food production’, the analysis looks at farm production, fertilisers and pesticides use, organic farming, catches at sea and aquaculture, the performance of the agricultural sector and waste generated;
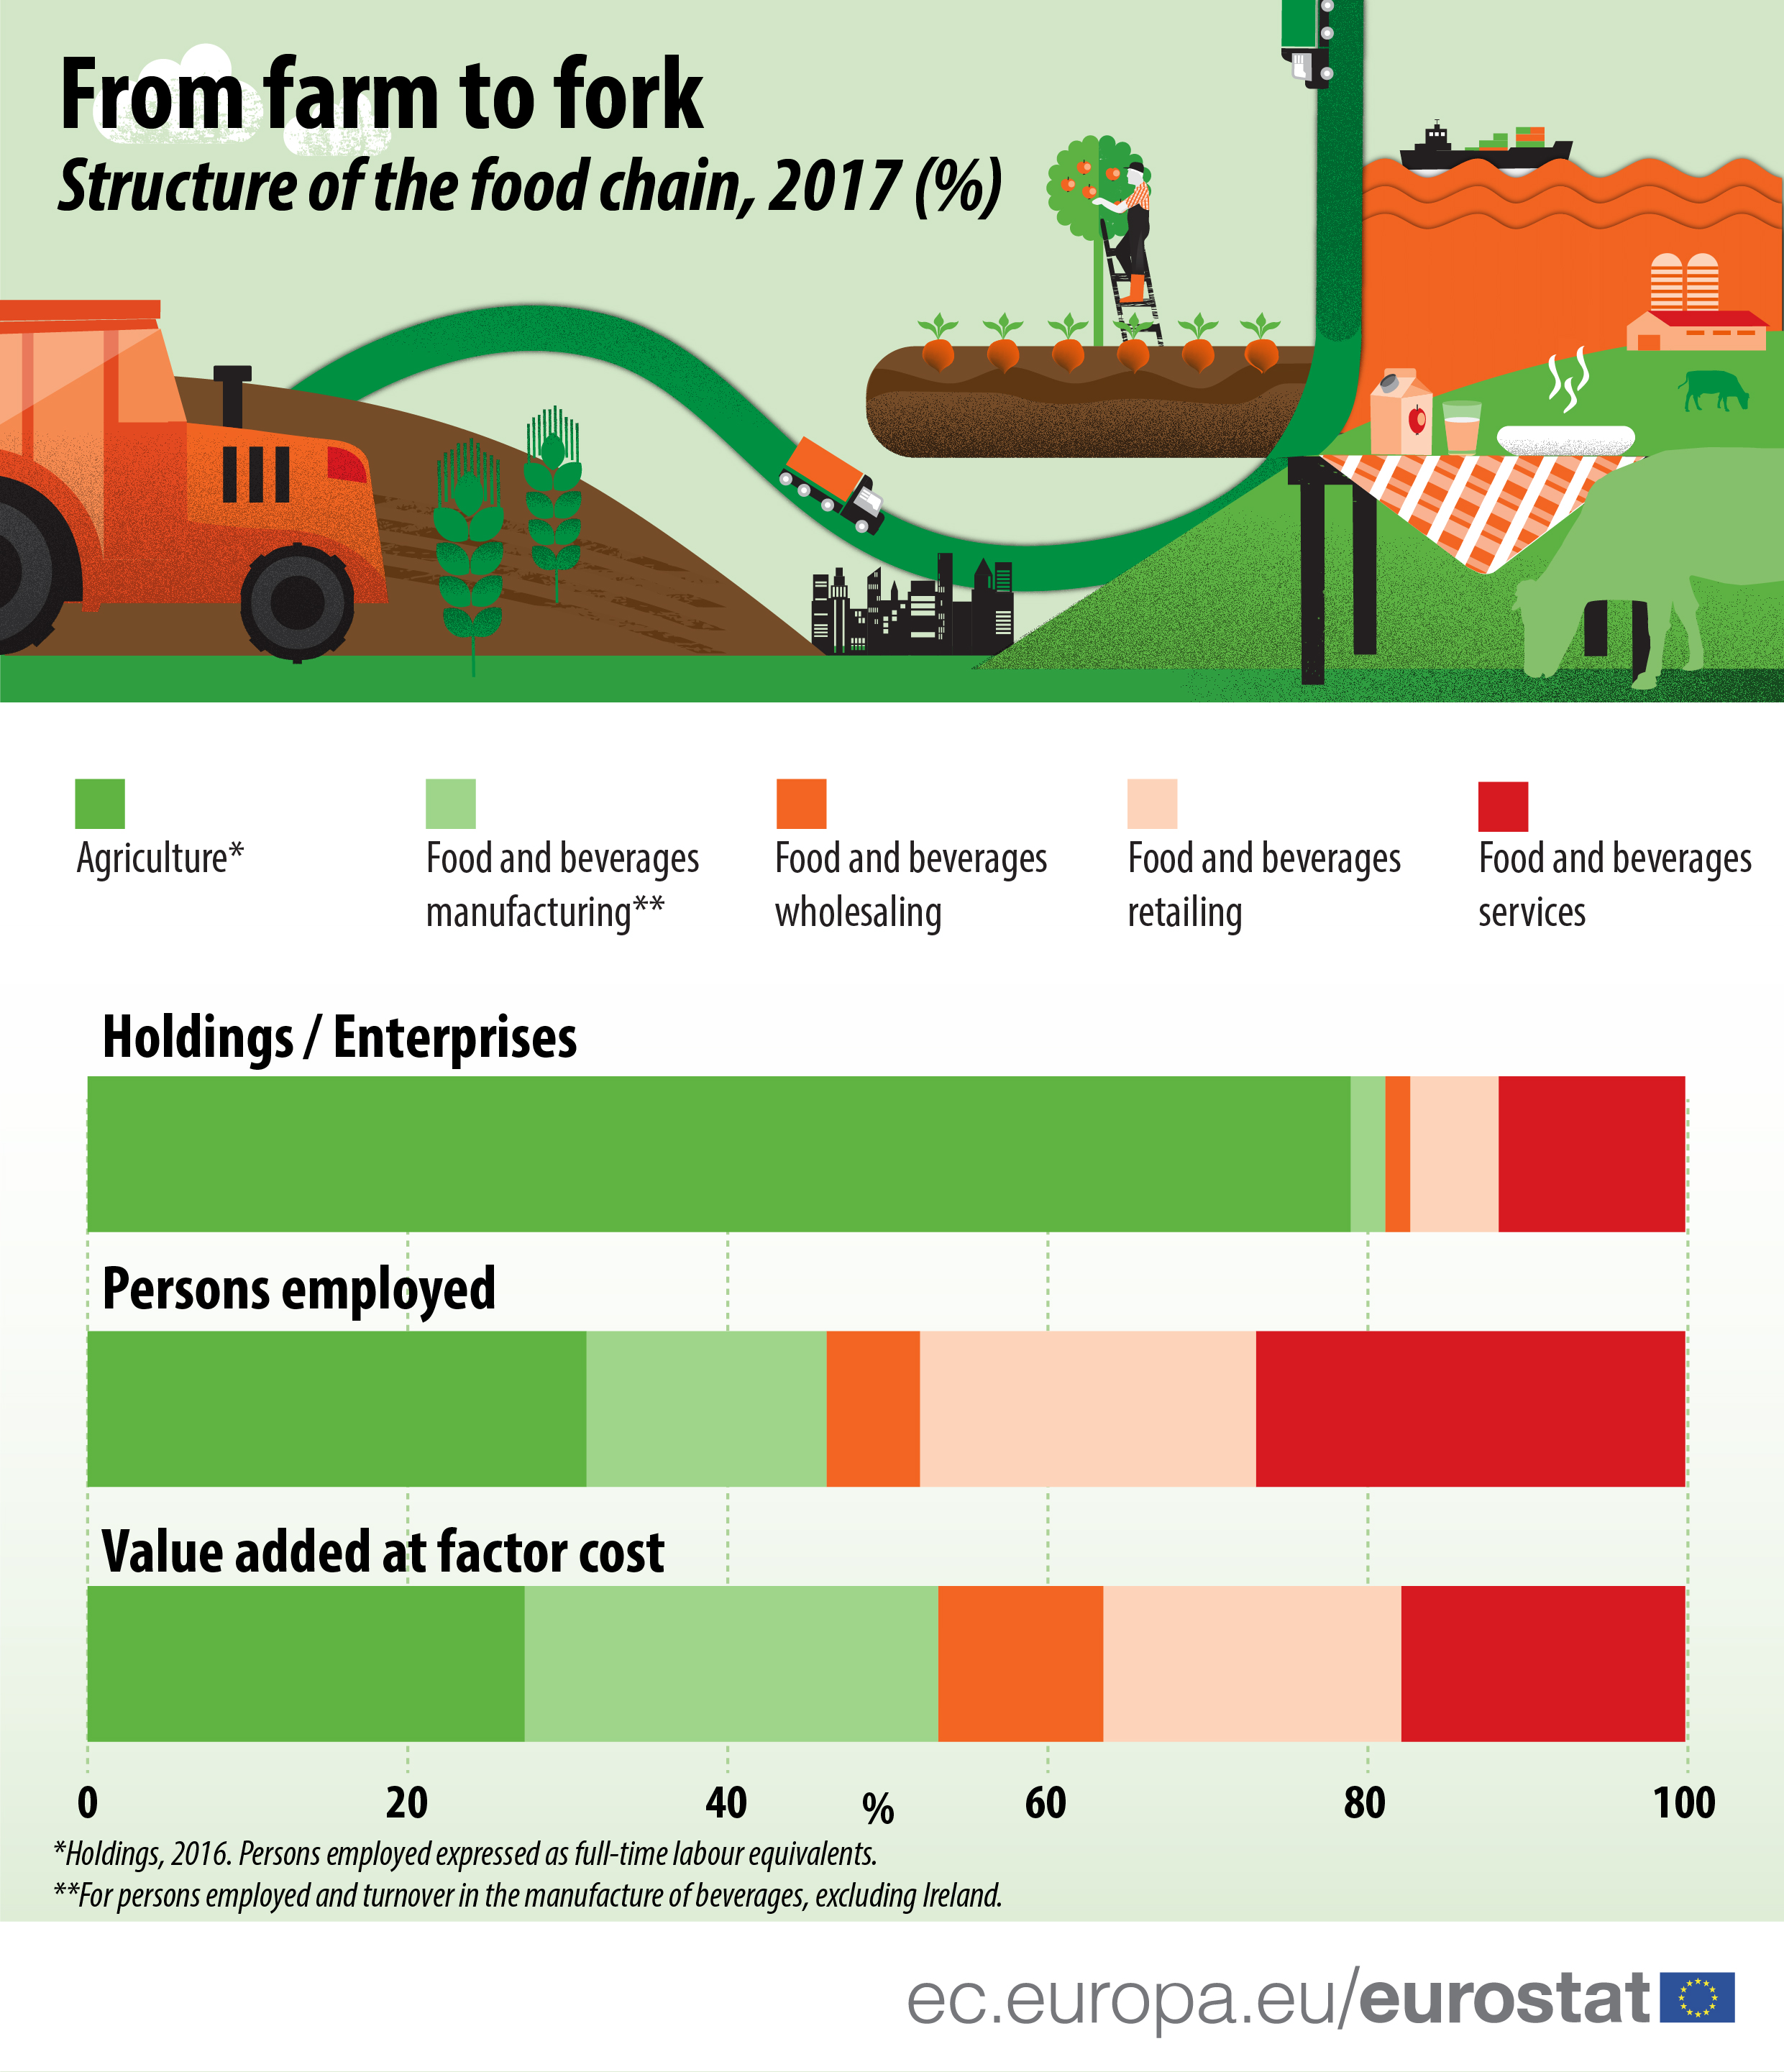
- on ‘stimulating sustainable food processing, wholesale, retail, hospitality and food services’ practices’, the analysis looks at the businesses involved, numbers of employees, the transport of goods, trade in agricultural goods and the generation of waste; and
- on ‘promoting sustainable food consumption, facilitating the shift towards healthy, sustainable diets’, the analysis looks at household expenditure on food and beverages and obesity rates.
The analysis also highlights how vulnerable this chain is to disruption, such as the COVID-19 pandemic. The collection and delivery of goods between stages is crucial for the function of the chain as a whole.
Disruption can come in any or all of the key stages of the chain, such as: a lack a seasonal workers at harvest times, disruptions in the transport network making deliveries from farms to processors (including slaughterhouses and dairies) or from manufacturers to retailers, and the closure of restaurants and bars.
For more information, read the Statistics Explained article ‘From farm to fork – a statistical journey’.
The impact of COVID-19 is not tackled in this Statistics Explained article. However, stay tuned for further, separate news items in the upcoming weeks.
To contact us, please visit our User Support page.
For press queries, please contact our Media Support.