
Small and medium-sized enterprises (SMEs) — in other words, enterprises with fewer than 250 persons employed — are often referred to as the backbone of the European economy, providing jobs and growth opportunities. However, following the coronavirus pandemic restrictions, they may also be among those worst affected by the slowdown in economic activity.
In 2017, an overwhelming majority (98.9%) of enterprises in the European Union’s non-financial business economy were enterprises with fewer than 49 persons employed (small enterprises), followed by medium enterprises (50-249 persons employed) with 0.9% of all enterprises. In contrast, just 0.2% of all enterprises had 250 or more persons employed and were therefore classified as large enterprises.
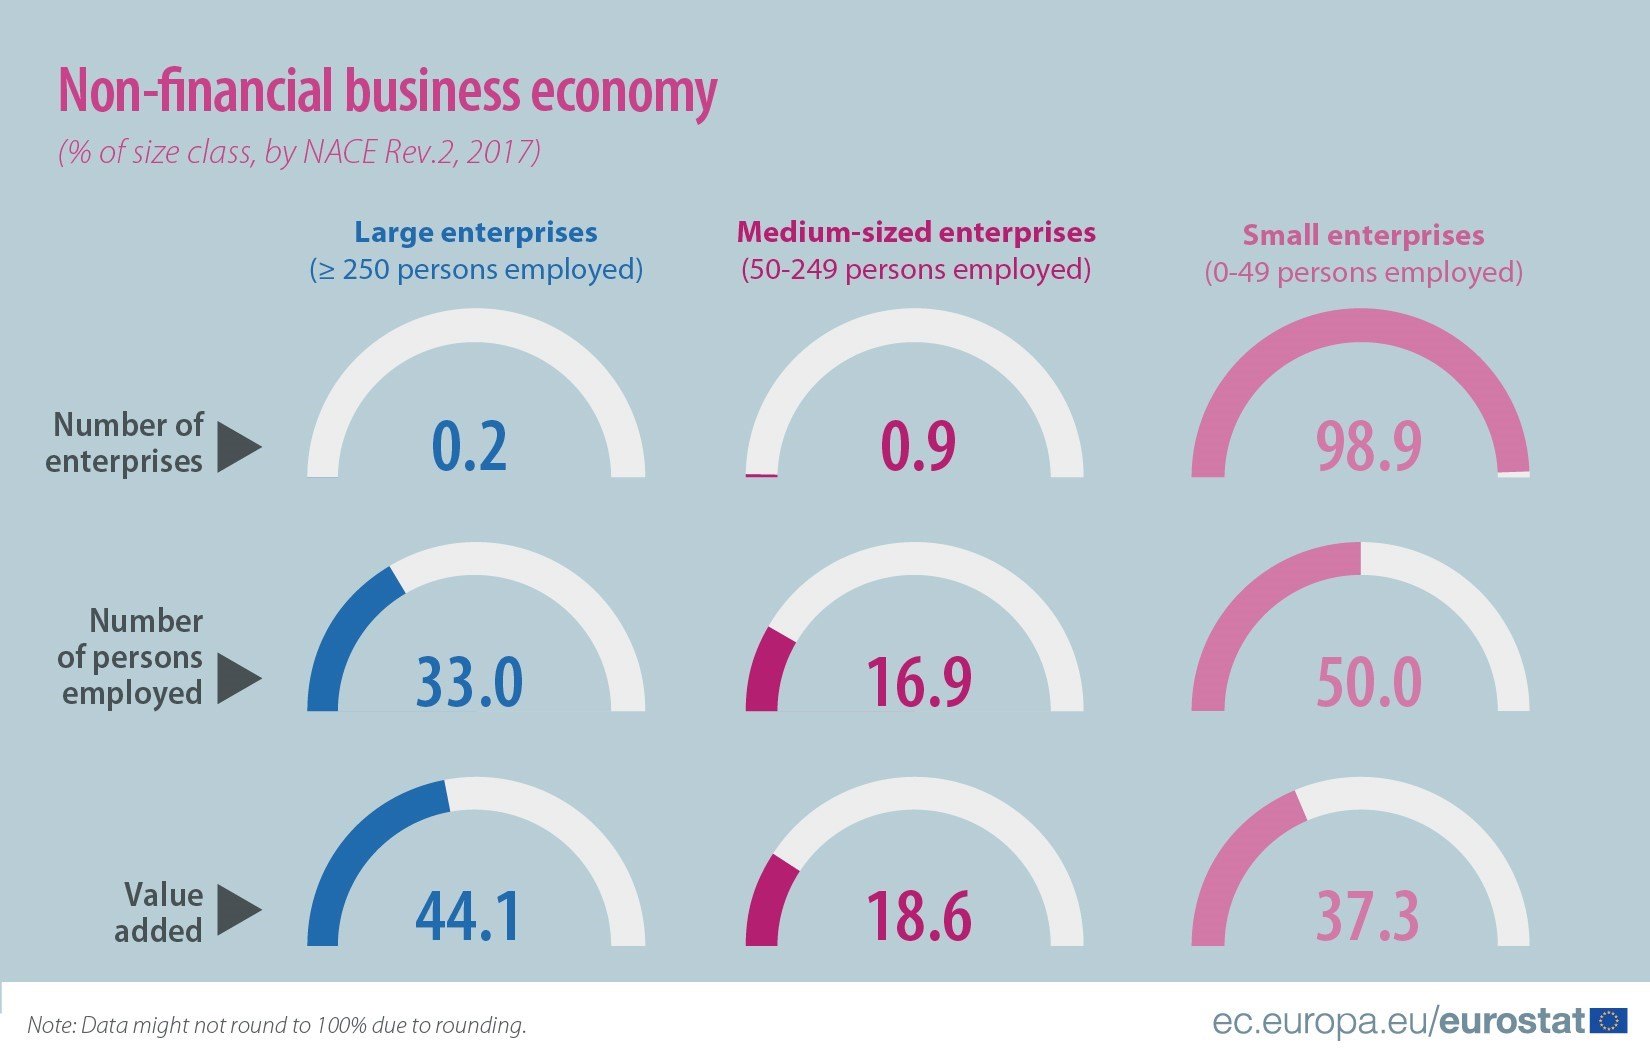
Source dataset: sbs_sc_sca_r2
Focus on SMEs
In 2017, there were 22.2 million SMEs in the EU’s nonfinancial business economy, contributing to over half of total value added (56%, EUR 3.5 billion).
SMEs employed 83.9 million people in 2017, accounting for 67% of all employed. Over half of them were employed in three economic activities: distributive trades sector (20.7 million people, 27% of small enterprises’ and 19% of medium-sized enterprises’ employment), manufacturing (15.8 million people, 14% and 33%) and construction (10.2 million, 14% and 7%).
Source dataset: sbs_sc_sca_r2
Among EU Member States with available data, the share of people employed by small enterprises was highest in Portugal*, where small enterprises employed 61% of all the employed, closely followed by Spain (58%), Latvia and Estonia (both 57%) as well as Slovakia (56%).
Medium-sized enterprises employed the highest shares of people in Luxembourg (25%), closely followed by Lithuania (23%), Estonia and Latvia (both 22%).
* Portuguese data are not displayed in the interactive visualisation tool for ‘persons employed’ as well as ‘gross valued added’ due to data confidentiality for medium and large companies. The same principle applies to other countries with unavailable data.
For more information, see the Statistics Explained article on structural business statistics, which are used as a source of information to understand the detailed structure, economic activity and performance of businesses.
Note: The European Union (EU) includes 27 EU Member States. The United Kingdom left the European Union on 31 January 2020. Further information is published here.
To contact us, please visit our User Support page.
For press queries, please contact our Media Support.