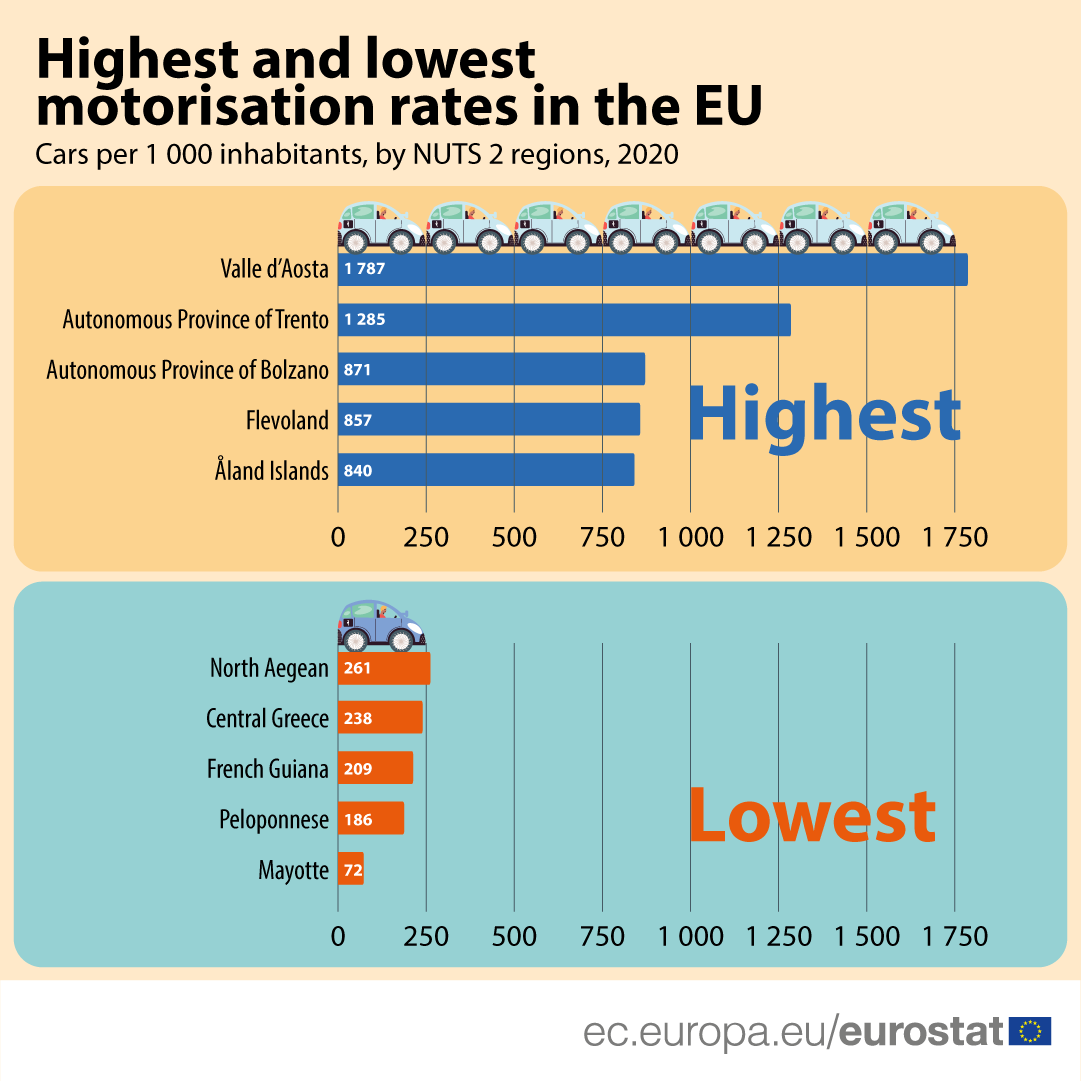
In 2020, there were 0.53 passenger cars per inhabitant in the EU. At the regional level, there were significant disparities in car ownership within the EU: apart from two extreme values (Valle d’Aosta and Mayotte), the highest regional rate (Autonomous Province of Trento) was nearly seven times the lowest one (Peloponnese).
In terms of passenger cars per 1 000 inhabitants, eastern Member States registered the lowest numbers, while the western Member States recorded higher rates but with some marked regional disparities.
Source dataset: tran_r_vehst
In 2020, three of the five highest motorisation rates (number of passenger cars per 1 000 inhabitants) were registered in Italy: Valle d’Aosta (1 787), the Autonomous Province of Trento (1 285) and the Autonomous Province of Bolzano (871). The other two were recorded in Flevoland (857) in the Netherlands and the Finnish region of Åland Islands (840).
These regional rates are often linked to the economic situation but can also be affected by specific circumstances: the high motorisation rate in Valle d’Aosta is influenced by taxation rules and the high rate in Flevoland is connected to its location close to a larger city.
On the other hand, the lowest motorisation rates were reported in two French (overseas departments) and three Greek regions: Mayotte (72), Peloponnese (186), French Guiana (209), Central Greece (238) and North Aegean (261).
Source dataset: tran_r_vehst
Motorisation rate for utility vehicles
The picture is quite different when looking at utility vehicles (lorries, road tractors and special vehicles excluding trailers and semi-trailers), where no systematic differences were observed between western and eastern European regions. The share of utility vehicles in the total number of road vehicles in a region depends on several factors. Among these are the regional transport systems and infrastructure for different modes of freight transport, such as motorways, railway lines, ports and airports capacity. The region's economic characteristics also play a role. Is the regional economy dominated by manufacturing industries or services? Or is the region located on key European freight corridors?
Twelve of the top 15 EU regions with the lowest shares of utility vehicles in all types of vehicles are in urbanised areas of Germany (ranging between 7.4% and 9.7%). Given a lack of 2020 data for Greece (which had the highest shares of utility vehicles in the total number of vehicles in 2019), the highest shares of utility vehicles in the total stock of vehicles in 2020 were located in Spain (9 of the 15 regions with the highest rates), ranging between 25.4% (Canary Islands) and 19.4% (Catalonia).
For more information:
- Statistics Explained article on stock of vehicles at regional level
- Dedicated section on transport statistics
- Database on transport statistics (Multimodal data > Regional transport statistics)
Methodological information:
- The names of the regions presented in the article are English translations of the original names.
To contact us, please visit our User Support page.
For press queries, please contact our Media Support.


