
In 2020, exports of recyclable raw materials – which include recyclable waste and scrap as well as secondary raw materials – from the EU Member States to non-EU countries amounted to 38.4 million tonnes. The volume of these exports has been on an upwards trend since 2004, reaching a peak in 2020 (a 70% increase compared with 2004).
On the other hand, imports of recyclable raw materials from non-EU countries into the EU amounted to 44.7 million tonnes in 2020, a slight decrease compared with 2019 (45.0 million tonnes) and an increase of about 2% compared with 2004 (43.7 million tonnes).

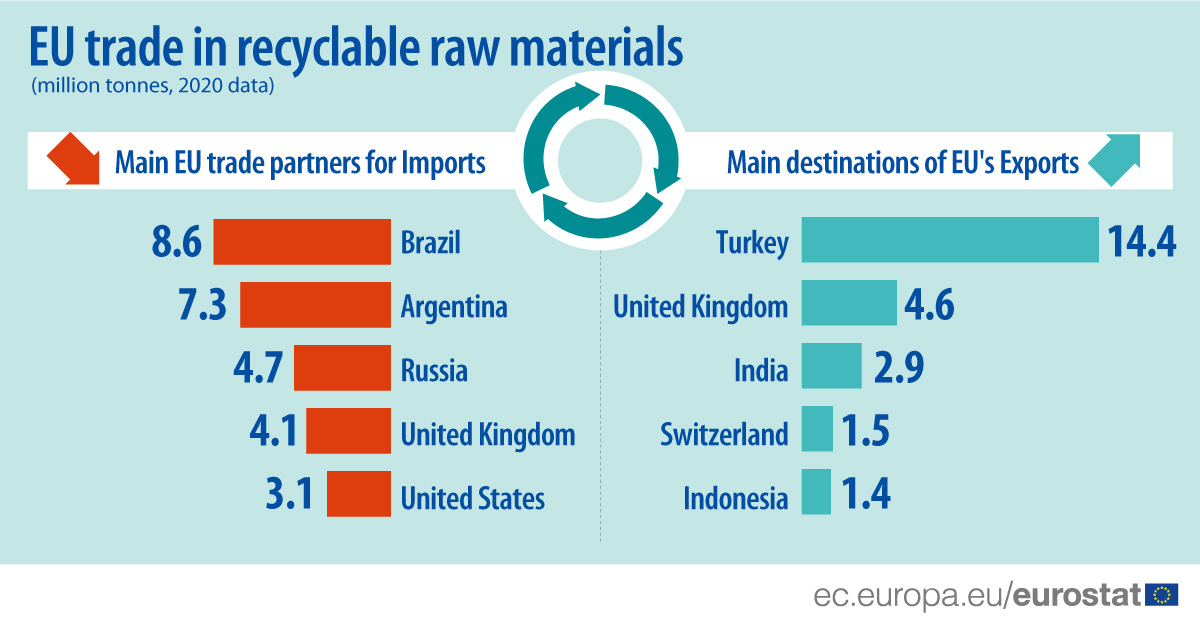
Türkiye and China main destinations of EU exports of recyclable raw materials
Türkiye was the largest destination for exports of recyclable raw materials from the EU, with a volume of around 14.4 million tonnes in 2020 compared with 12.0 million tonnes in 2019. The second largest destination was the United Kingdom, which received almost 4.6 million tonnes in 2020, followed by India (2.9 million tonnes), Switzerland (1.5 million tonnes) and Indonesia (1.4 million tonnes).
Brazil and Argentina biggest sources of EU imports of recyclable raw materials
In 2020, EU imports of recyclable raw materials were predominantly from Brazil (8.6 million tonnes) and Argentina (7.3 million tonnes), followed by Russia (4.7 million tonnes) the United Kingdom (4.1 million tonnes) and the United States (3.1 million tonnes).
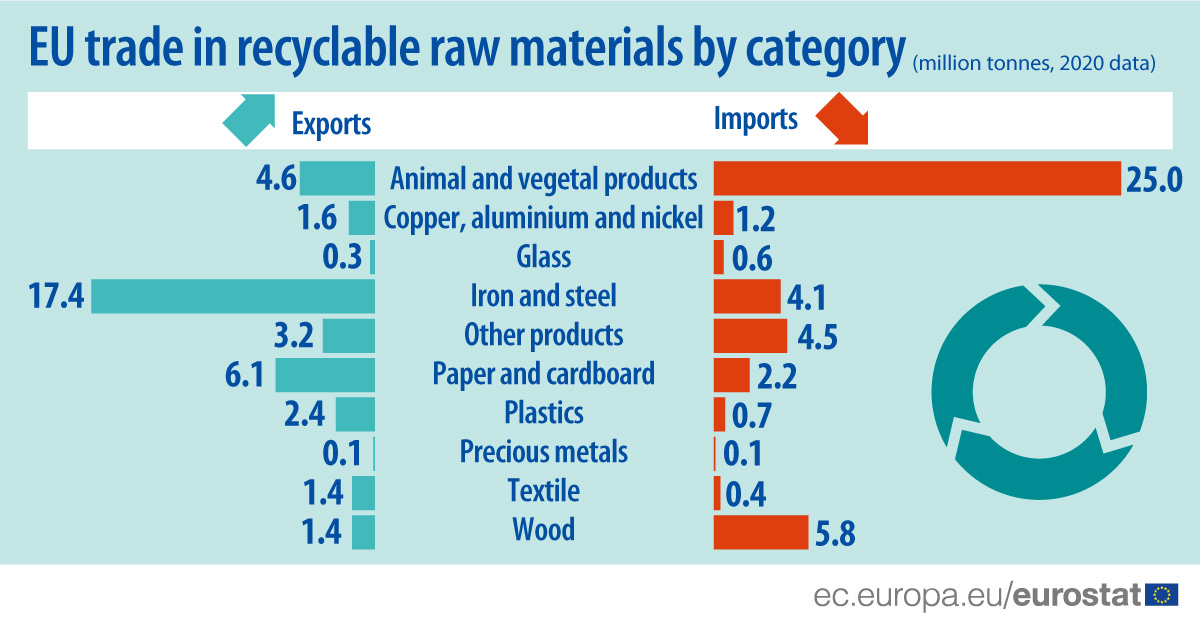
45.3% of all recyclable raw materials exports from the EU was ferrous metals
In 2020, the exports of ferrous metals (iron and steel) from the EU amounted to 17.4 million tonnes, accounting for almost half (45.3%) of all recyclable raw materials exports. The second largest category was paper and cardboard (6.1 million tonnes or 15.8%) followed by animal and vegetal products (4.6 million tonnes or 12.1%).
When looking at the imports to the EU, the largest category was by far animal and vegetal products (25.0 million tonnes), accounting for more than half (56%) of all recyclable raw materials imports. The second largest category was wood at 5.8 million tonnes or 13.1%, followed by ferrous metals (iron and steel) that amounted to 4.1 million tonnes or 9.1%.
For more information:
- The news item is based on data from this special data extraction.
- These recyclable waste and scrap and secondary raw materials are recycled and re-injected into the economy as new raw materials. The scope of ‘recyclable raw materials’, as a difference from the data on trade in waste, includes only waste that can be recycled. It also includes secondary raw materials (by-products). They are measured in terms of relevant product codes from the Combined Nomenclature used in International Trade in Goods Statistics – see list of the codes.
To contact us, please visit our User Support page.
For press queries, please contact our Media Support.