
Household electricity prices decreased in the European Union (EU) by 2.3% on average between the second half of 2015 and the second half of 2016. They now stand at €20.5 per 100 kWh. In the same period, household gas prices went down by 10.5% on average to €6.4 per 100 kWh.
Since 2008, electricity prices in the EU have risen by around a quarter (+23%) and gas prices by 2.6%.
On average, taxes and levies accounted for more than a third (36%) of the electricity bills charged to households in the second half of 2016, and about a quarter (26%) of the gas prices.
Largest fall in electricity prices in the Netherlands, highest increase in Belgium
Between the second half of 2015 and the second half of 2016, the largest decreases in household electricity prices, in national currencies, were observed in the Netherlands (-13.8%) and Cyprus (-11.8%), followed by Lithuania (-5.8%), Romania (-5.6%) and Ireland (-4.7%). In contrast, the most noticeable increase was registered in Belgium (+16.7%), well ahead of Sweden (+7.7%) and Portugal (+3.5%).
Expressed in euro, average household electricity prices in the second half of 2016 were lowest in Bulgaria (€9.4 per 100 kWh), Hungary (€11.3) and Lithuania (€11.7), and highest in Denmark (€30.8), Germany (€29.8) and Belgium (€27.5).

The source dataset can be found here.
When expressed in purchasing power standards (PPS), it can be seen that, relative to the cost of other goods and services, the lowest household electricity prices were found in Finland (12.8 PPS per 100 kWh), Luxembourg (14.4) and the Netherlands (14.7), and the highest in Portugal (30.2), Germany (28.7), Belgium (25.7), Spain (25.6) and Romania (25.4).
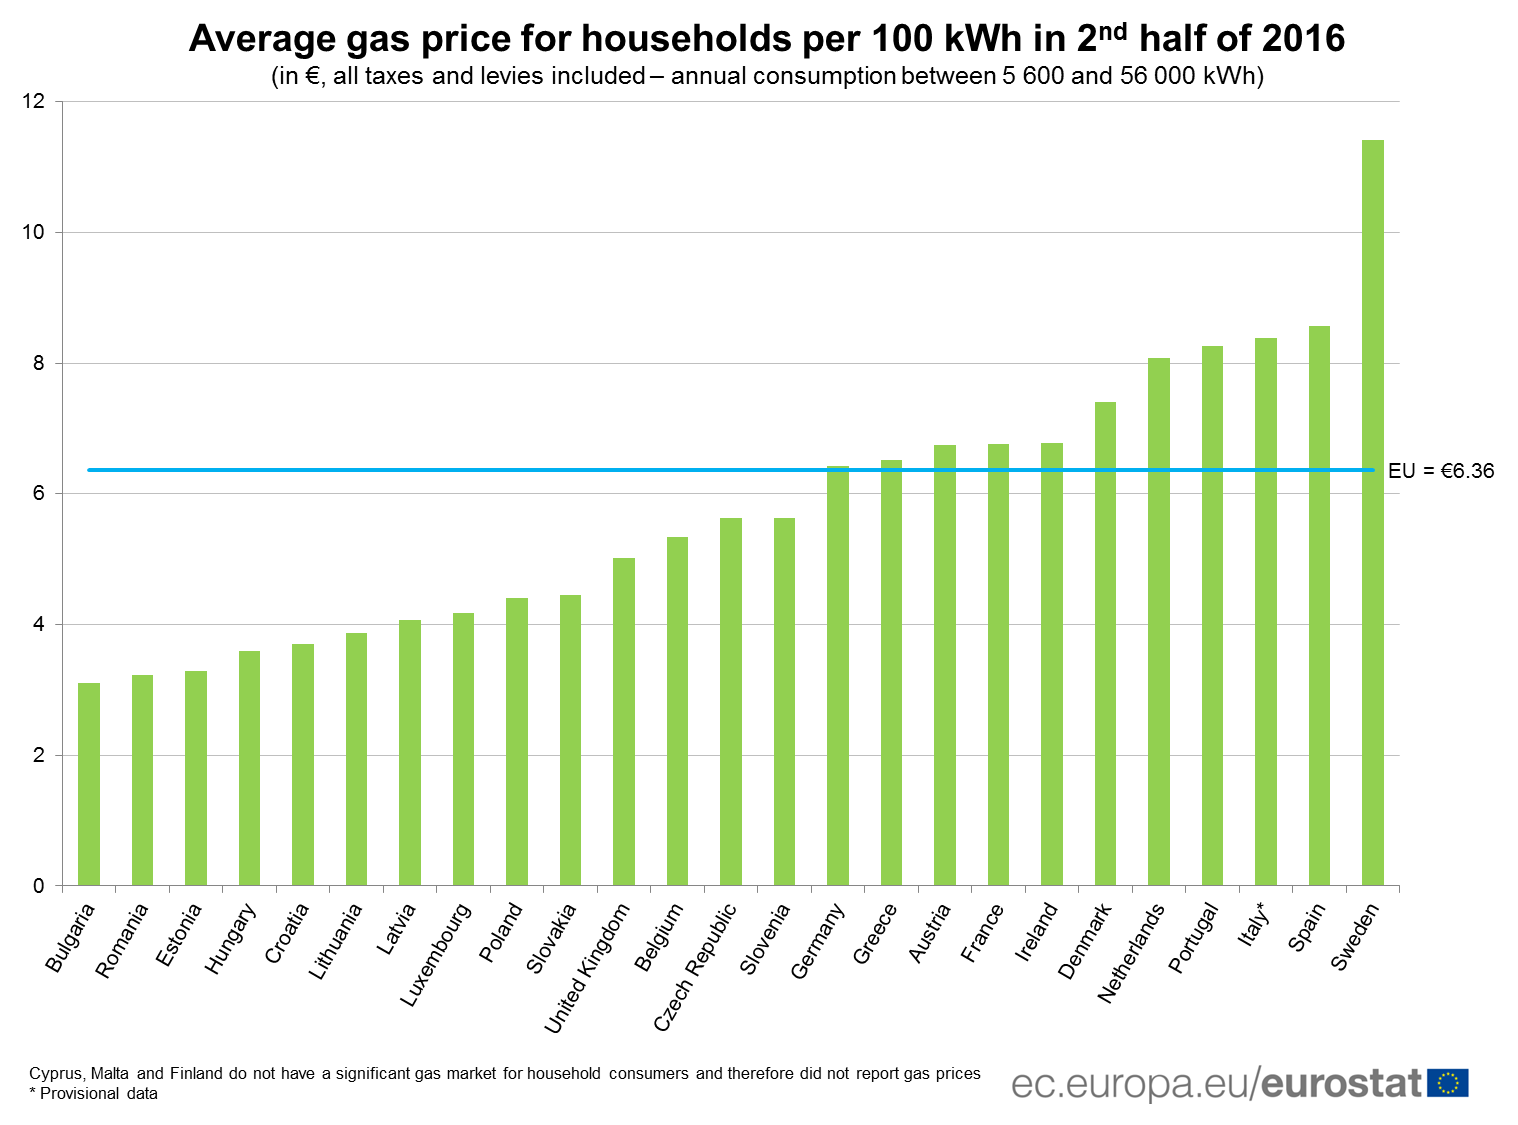
Largest fall in gas prices in Croatia and Bulgaria
Between the second half of 2015 and the second half of 2016, household gas prices, expressed in national currencies, decreased in all Member States, except in Hungary (+1.5%), the Netherlands (+0.6%) and Sweden (+0.2%). The largest falls were observed in Croatia and Bulgaria (both -20.4%), ahead of Latvia (-16.3%), Portugal (-15.9%), Estonia (-14.6%), Belgium (-14.0%), Luxembourg (-13.3%) and Greece (-13.1%).
Expressed in euro, the average household gas prices in the second half of 2016 were lowest in Bulgaria (€3.1 per 100 kWh), Romania (€3.2), Estonia (€3.3), Hungary (€3.6) and Croatia (€3.7) and highest in Sweden (€11.4), followed by Spain (€8.6), Italy (€8.4), Portugal (€8.3) and the Netherlands (€8.1).
The source dataset can be found here.
Adjusted for purchasing power, it can be seen that, relative to the cost of other goods and services, the lowest household gas prices were recorded in Luxembourg (3.5 PPS per 100 kWh), followed by Estonia (4.6), the United Kingdom (4.7) and Belgium (5.0). In contrast, the highest prices were registered in Portugal (10.6), Spain (9.6), Sweden (9.2), the Czech Republic (8.8) and Italy (8.6).
For more information:
Eurostat website section dedicated to energy statistics.
Eurostat database on energy.
Eurostat methodology on energy prices.
Eurostat Statistics Explained articles on electricity and natural gas price statistics.