
In 2019, industry remained the largest economic activity in the EU measured in terms of output generated. Industry accounted for 19.7% of EU total gross value added (GVA), closely followed by ‘wholesale and retail trade, transport, accommodation and food services’ (19.2%) and ‘public administration, defence, education, human health and social work activities’(18.7%). Meanwhile, ‘professional, scientific and technical activities’ accounted for 11.4% of EU total GVA, while ‘real estate activities’ accounted for 10.8%.
The respective shares of GVA from these economic activities have followed diverging trends over the past 20 years.
Although ‘industry’ continued to account for the largest share of EU’s GVA in 2019, it has registered the sharpest decline over the past two decades (from 22.6% in 1999 to 19.7% in 2019; -2.9 percentage points (pp)). Over this period, the share of GVA decreased also in ‘agriculture, forestry and fishing’ (-0.7 pp), ‘financial & insurance activities’ (-0.4 pp), ‘construction’ (-0.3 pp) and ‘arts, entertainment & recreation; other services’ (-0.2 pp).
In contrast, the percentage of GVA generated by ‘professional, scientific and technical activities’ rose from 9.4% in 1999 to 11.4% in 2019 (+2.0 pp), while the percentage of GVA from ‘real estate activities’ increased from 9.6% in 1999 to 10.8% in 2019, +1.2 pp). Increases were also observed in ‘public administration, defence, education, human health and social work activities’ (+0.7 pp) and ‘information and communication’ (+0.6 pp), while it remained stable for ‘wholesale and retail trade, transport, accommodation and food services’.

Source dataset: nama_10_a10
Share of trade in total GVA highest in Lithuania
In 13 EU Member States, ‘wholesale and retail trade, transport, accommodation and food services’ accounted for the largest economic activity in terms of gross value added generated in 2019. The highest shares of GVA were recorded in Lithuania (31.4% of total GVA), ahead of Greece (27.6%), Poland (26.0%), Cyprus (25.3%), Latvia (24.8%) and Portugal (24.5%).
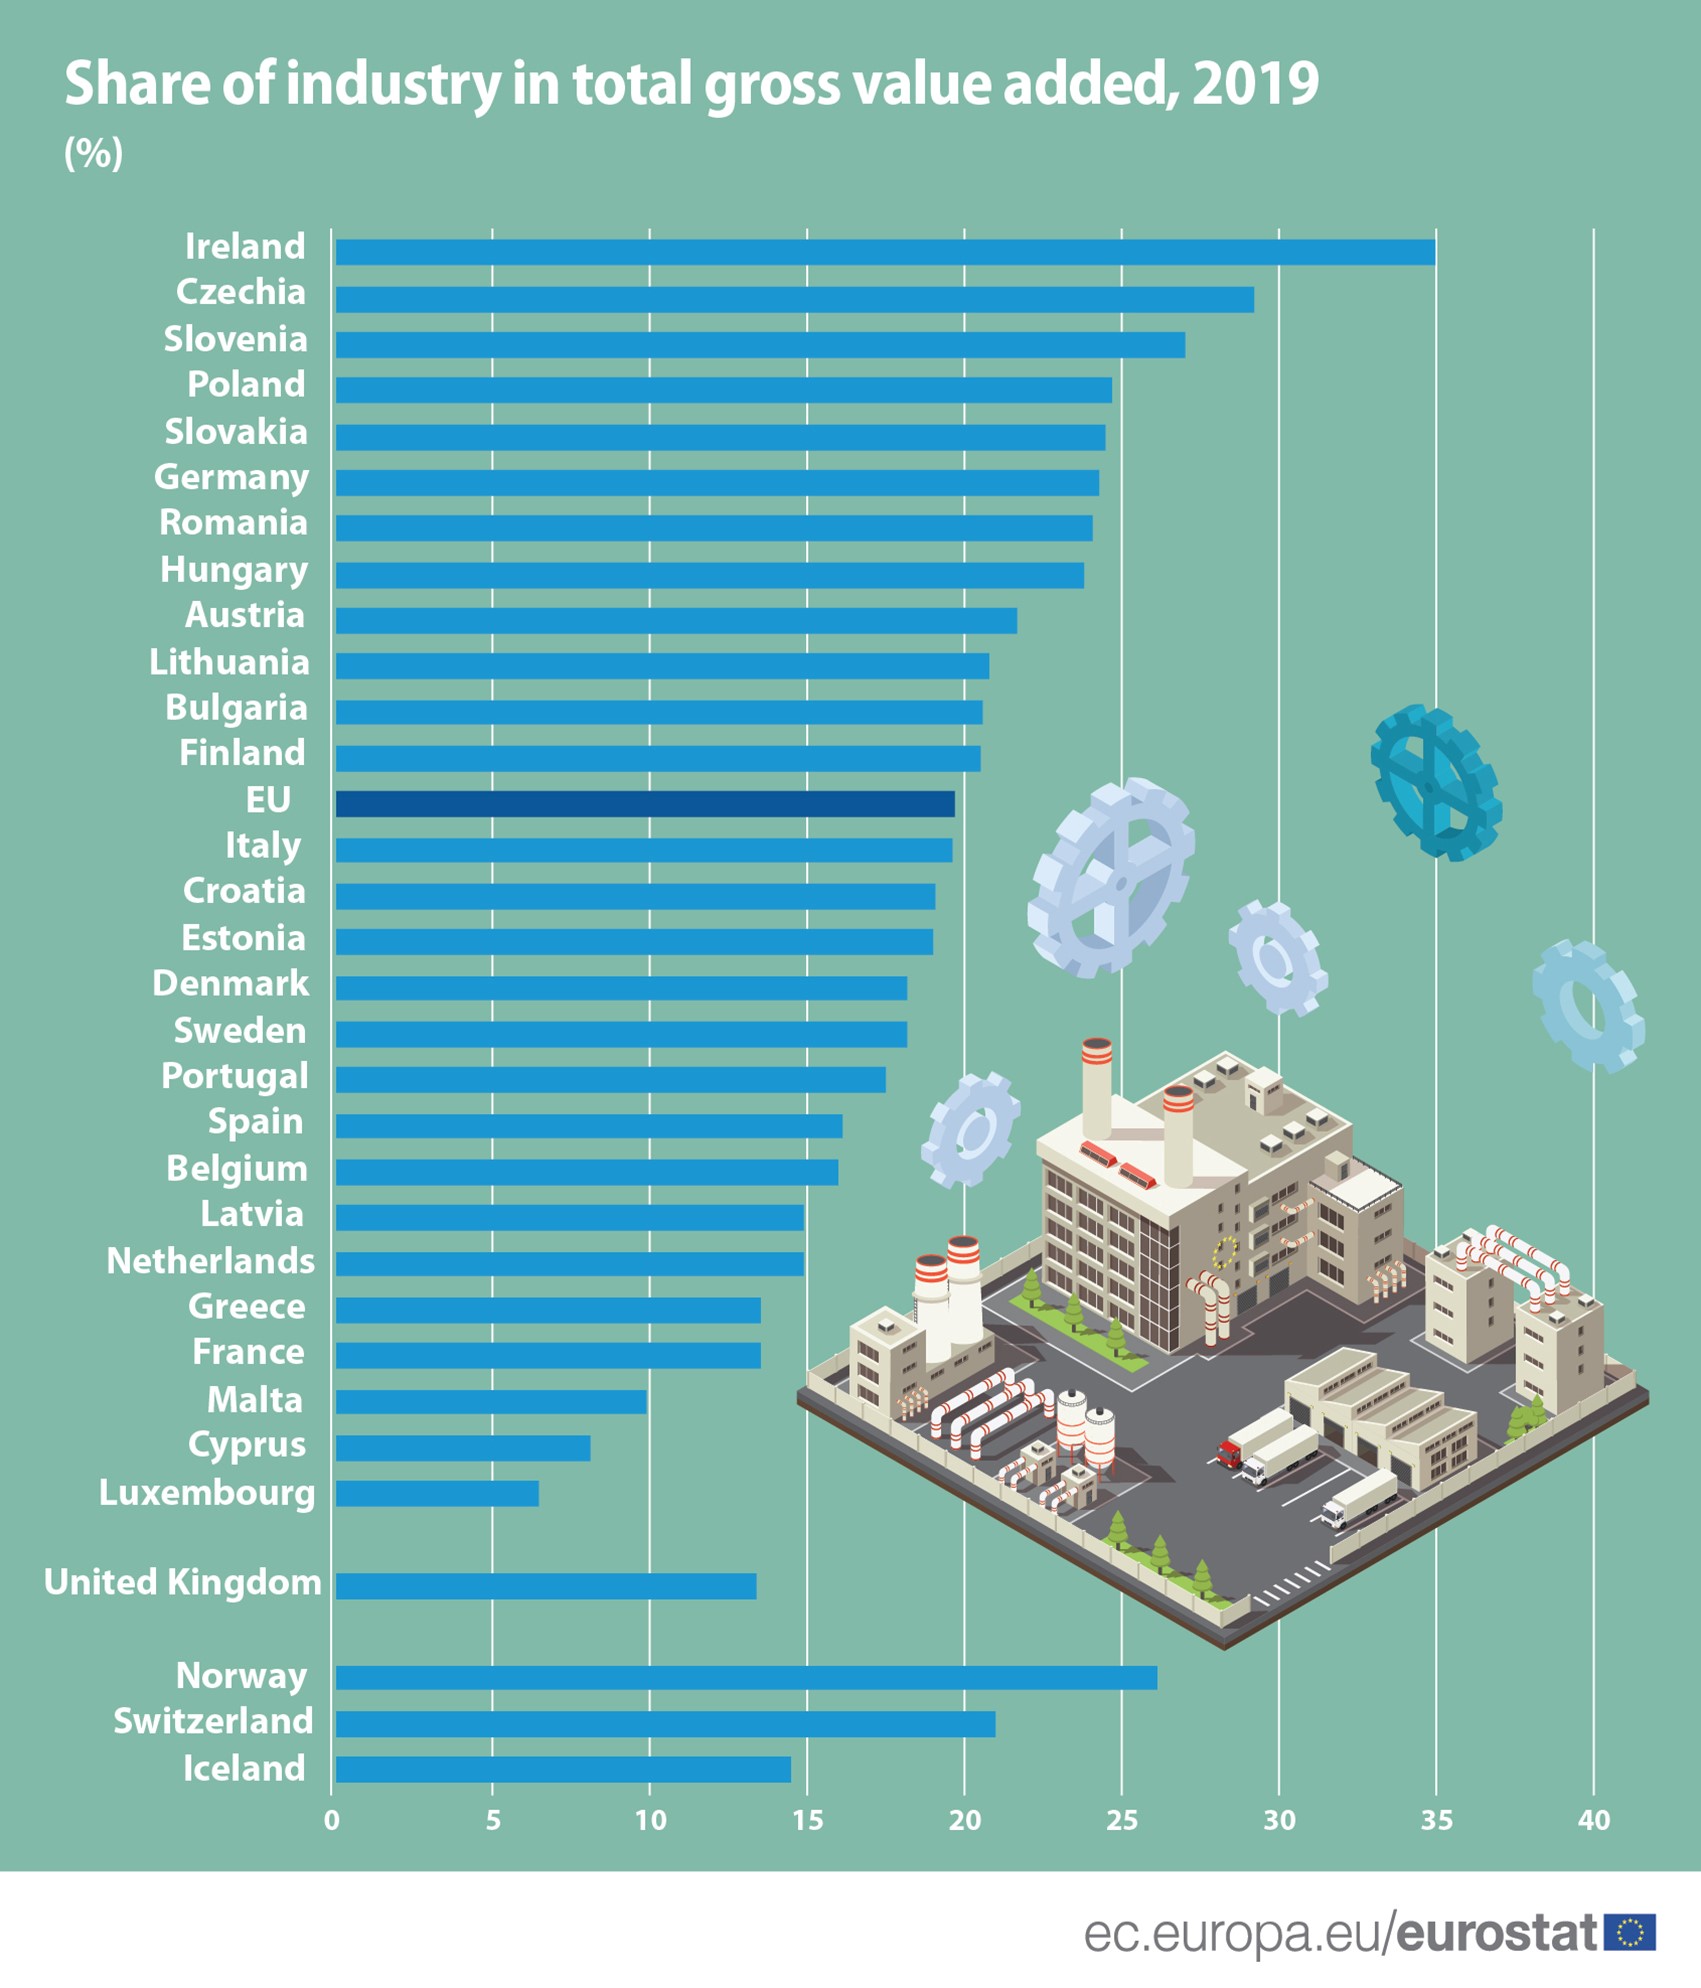
Share of industry highest in Ireland
In 8 EU Member States, ‘industry’ was the largest economic activity, whilst it accounted for at least a quarter of gross value added generated in the following EU Member States: Ireland (35.0%), Czechia (29.2%) and Slovenia (27.0%).
Source dataset: nama_10_a10
Share of public administration and activities highest
in France ‘Public administration, defence, education, human health and social work activities’ was the main economic activity in terms of GVA in 5 EU Member States: France (21.9%), followed by Belgium and Sweden (both 21.3%), the Netherlands (21.1%) and Denmark (20.8%).
Luxembourg was the only member state where ‘financial and insurance activities’ represented the economy’s main economic activity, generating 26.8% of total gross value added.
Note: The European Union (EU) includes 27 EU Member States. The United Kingdom left the European Union on 31 January 2020. Further information is published here.
To contact us, please visit our User Support page.
For press queries, please contact our Media Support.