Shedding light on energy in Europe – 2024 edition
Lighting, heating, moving, producing: energy is vital for our day-to-day life.
Without energy, people and businesses cannot function. Turning on our computers or starting our cars are actions that we take for granted, yet they represent the final stage of a complex process.
This publication helps to make the complex topic of energy more understandable. It is aimed at the needs of those who are not familiar with the energy sector as well as more experienced users.
Energy sources
This section focuses on the different energy sources available in the EU – the energy produced in the EU as well as the energy imported.
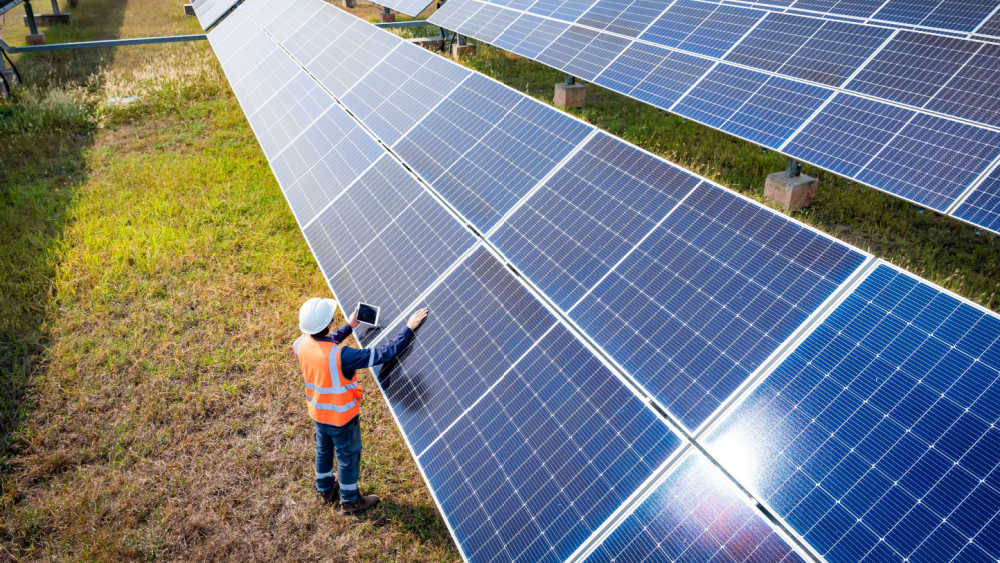
43% of energy produced in the EU in 2022 came from renewables.
Energy mix
The energy available in the European Union (EU) comes from energy produced in the EU and from energy imported from third countries. Therefore, to get a good overview of the total energy available in the EU, energy production should always be put into context alongside imports.
In 2022, the EU produced around 37% of its own energy, while 63% was imported.
Petroleum products have the largest share in the EU energy mix
In 2022, the energy mix in the EU, meaning the range of energy sources available, mainly consisted of five different sources: crude oil and (37%), natural gas (21%), (18%), (13%) and (11%).
The shares of the different energy sources in the vary considerably between EU countries. In 2022, the share of petroleum products in available energy was highest in Cyprus (87%), Malta (86%) and Luxembourg (61%), while natural gas was a significant energy source in Italy (37%), Hungary (31%), Ireland and the Netherlands (both 30%). Renewables had the largest share in Sweden (50%) and Latvia (42%), while nuclear energy accounted for 35% of energy available in France and 26% in Sweden. The share of solid fossil fuels was highest in Estonia (58%) and Poland (41%).
For more information
Energy production
The in the EU is spread across a range of different energy sources: , natural gas, crude oil, , and (such as hydro, wind and solar energy).
Renewable energies account for the highest share in energy production
Renewable energy (43% of total EU energy production) was the largest contributing source to energy production in the EU in 2022. Nuclear energy (28%) was the second largest source, followed by solid fuels (19%), natural gas (6%) and crude oil (3%).
However, the production of energy is very different from one EU country to another. In 2022, renewable energy was the exclusive source of energy production in Malta (in other words, this country did not produce any other type of energy) and represented at least half in 15 other EU countries, with shares of 99.6% in Latvia, 98% in Portugal and 96% in Cyprus. The production of nuclear energy was quite significant in France (71% of total national energy production), Belgium (67%) and Slovakia (61%). Solid fuels were the main source of energy produced in Poland (70%), Estonia (59%), Czechia (46%) and Bulgaria (45%). Natural gas had the largest share in the Netherlands (53%), Ireland (37%) and Romania (34%), while the share of crude oil was largest in Denmark (33%).
Energy imports and imports dependency
For its own consumption, the EU also needs energy that is imported from third countries. In 2022, the main imported energy product category was oil and petroleum products (including crude oil, which is the main component), accounting for 63% of energy imports into the EU, followed by natural gas (26%) and solid fossil fuels (7%).
Different patterns among EU countries
In 2022, in EU countries' energy imports, the highest shares of oil and petroleum products were in Cyprus (94%) and Malta (87%), of natural gas in Italy and Hungary (both 39%), and of solid fossil fuels in Poland (18%), Slovakia and Czechia (both 14%).
You can discover the main trading partners of your country and see the different trade flows using the interactive visualisation tool on energy trade.
Russia main EU supplier of oil and petroleum products, natural gas and solid fossil fuels in 2022
In 2022, more than half of the extra-EU oil and petroleum imports originated from five countries: Russia (21%), the United States (11%), Norway (10%), Saudi Arabia, and the United Kingdom (both 7%). A similar analysis shows that 64% of the EU's imports of natural gas came from Russia (23%), Norway (17%), the United States (14%) and Algeria (11%), while the biggest solid fossil fuel (mostly coal) imports originated from Russia (23%), followed by the United States (18%), Australia (16%), South Africa (14%) and Colombia (13%).
Due to the EU sanctions imposed as a consequence of the Russian war of aggression against Ukraine since 2022, this situation is subject to change. The latest developments can be monitored via Eurostat’s monthly data.
EU energy imports dependency rate was 63% in 2022
The shows the extent to which an economy relies upon imports to meet its energy needs. It is measured by the share of net imports (imports minus exports) in gross inland energy consumption (meaning the sum of energy produced and net imports).
In the EU in 2022, the energy imports dependency rate was equal to 63%, which means that 63% of the EU’s energy needs were met by net imports. However, the dependency rate varied across the EU countries, ranging from 99% in Malta, 92% in Cyprus, and 91% in Luxembourg to 6% in Estonia.
Energy consumption
This section presents the different types of energy consumed, electricity production, electricity and gas prices, and outlines the energy flows from production to final consumption.
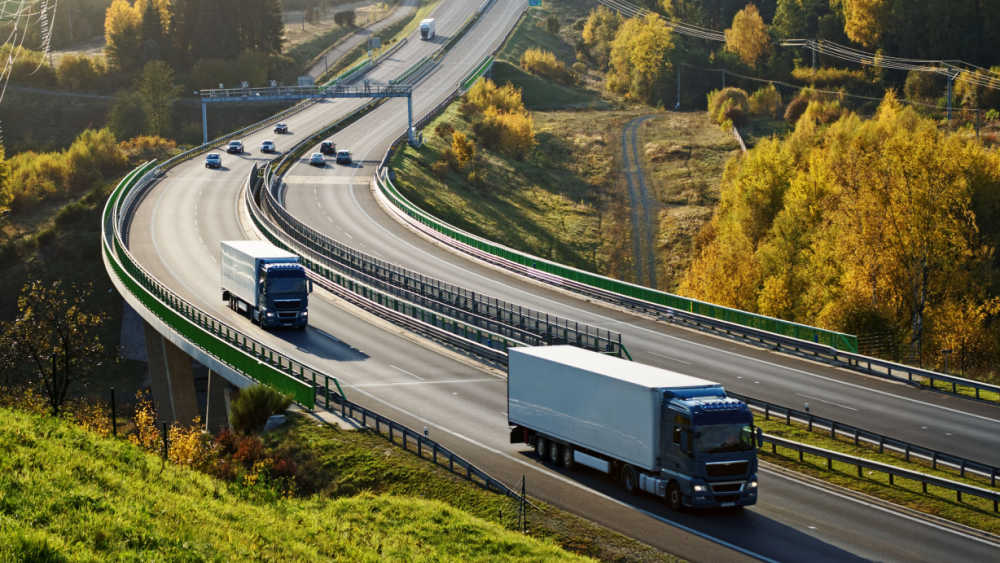
31% of energy in the EU in 2022 was consumed by the transport sector.
Types of energy consumed
In 2022, out of the in the EU, 67% was (final energy consumption), for example EU citizens, industry, and transport. The remaining 33% was mainly lost during electricity generation and distribution, used to support energy production processes, or consumed in non-energy uses (like asphalt or bitumen).
Petroleum products are the most consumed
In the EU in 2022, (such as heating oil, petrol, diesel fuel) represented 37% of final energy consumption, followed by electricity (23%), natural and manufactured gas (21%), direct use of (not transformed into electricity, for example wood, solar thermal, geothermal or biogas for space heating or hot water production; 12%), (such as district heating; 5%) and (mostly coal; 2%). The real consumption of renewable energy (23%) was higher than the direct use (12%), shown in the visualisation underneath, because other renewable sources, such as hydropower, wind power and solar photovoltaic, are included in electricity in the visualisation.
Within the EU countries, the final energy consumption pattern varied considerably in 2022. Petroleum products made up 55% of final energy consumption in Cyprus, Luxembourg, and Malta. Electricity accounted for 39% in Malta and 34% in Sweden, while gas made up 36% in the Netherlands and 29% in Slovakia, Hungary and Italy. Direct use of renewable energies accounted for 29% of final energy consumption in Sweden and 28% in Finland.
The transport sector accounted for 31% of final energy consumption in the EU in 2022
In 2022 in the EU, the different had the following shares in final energy consumption: The transport sector (31% of final energy consumption in rail, road, domestic aviation, and inland shipping) had the highest share, followed by energy consumed by private households in citizens’ dwellings (27%), industry (25%), commercial and public services (13%), and agriculture, forestry and fishing (3%).
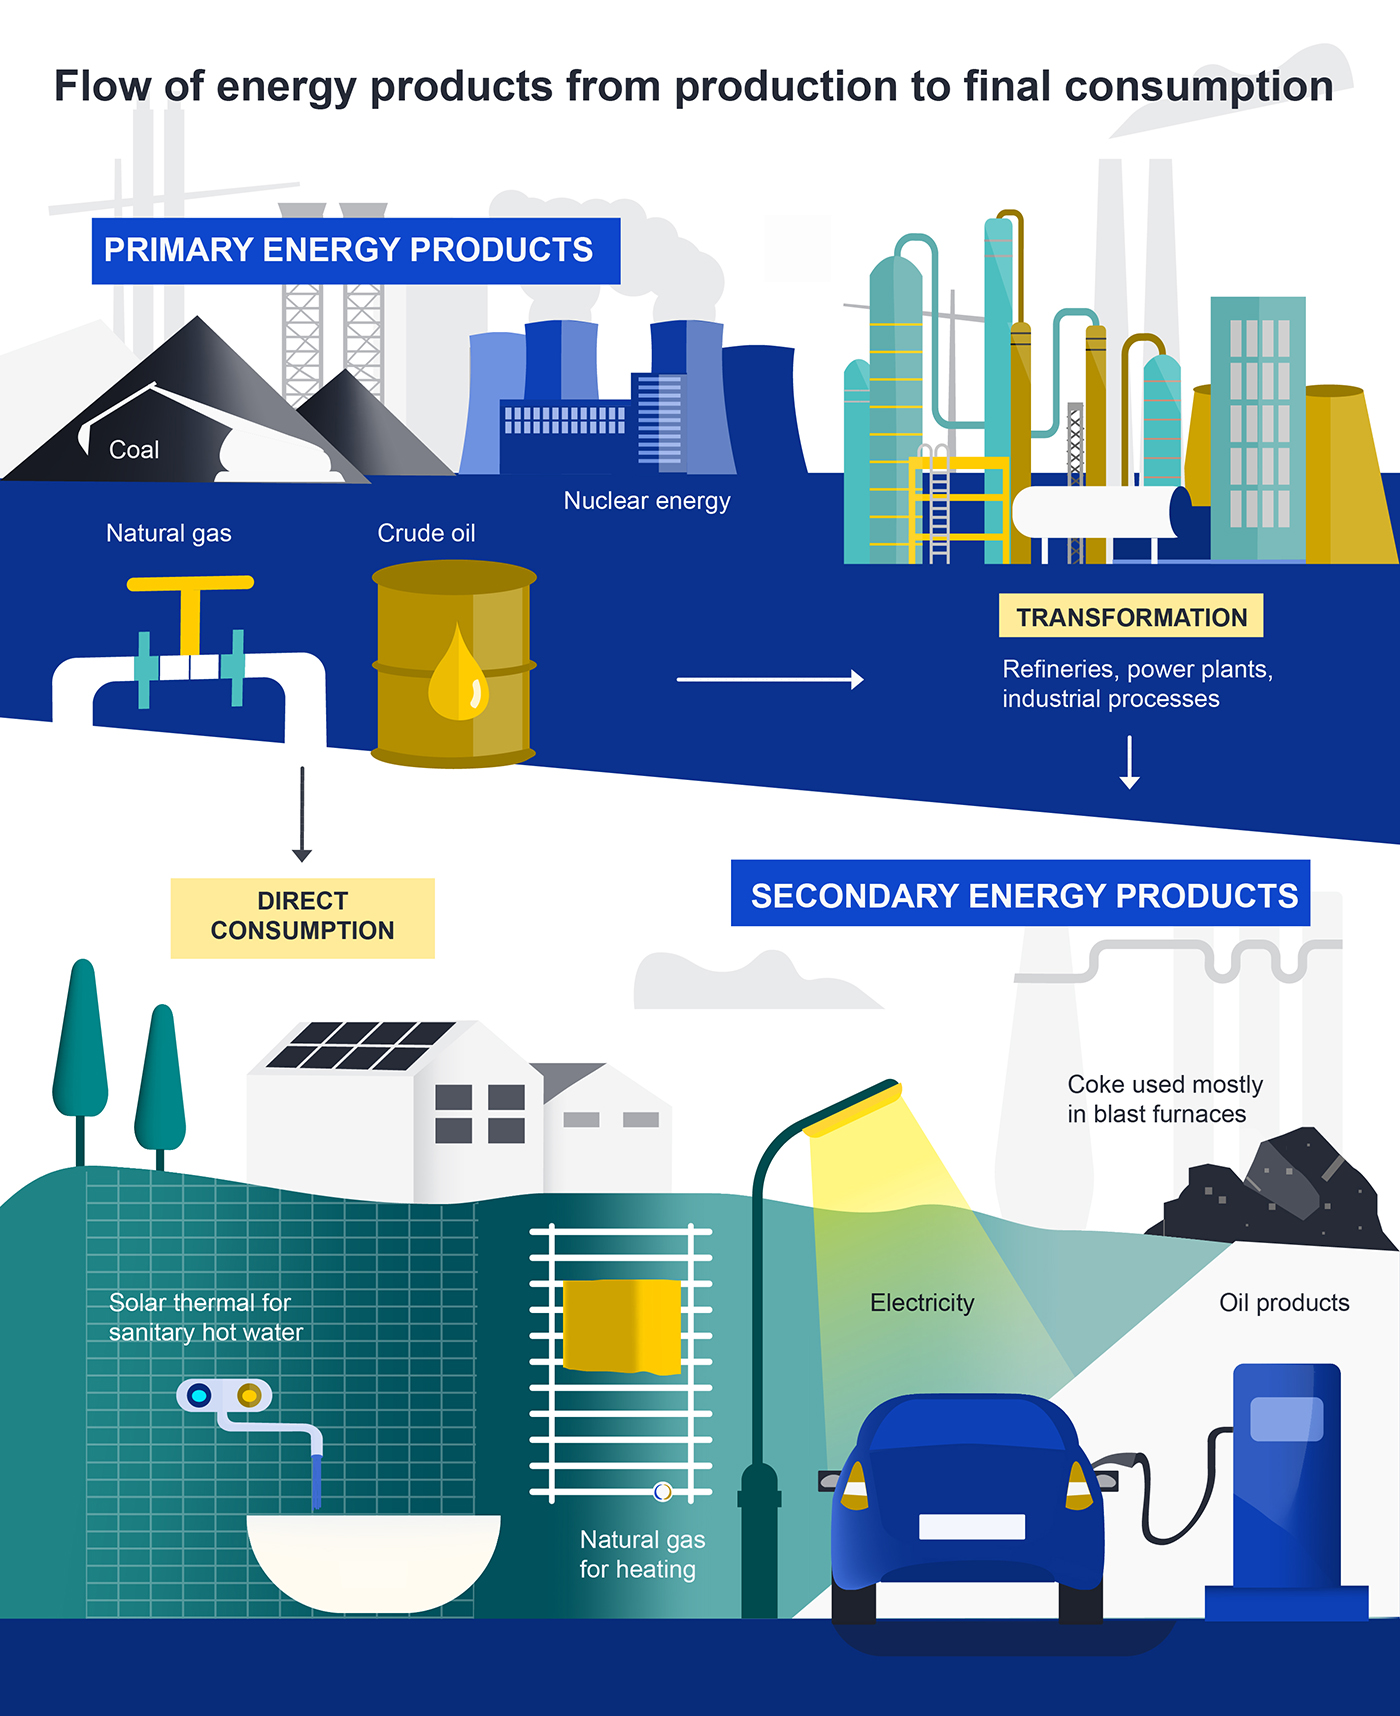
From production to final consumption
To properly interpret energy statistics, it is necessary to distinguish between primary and secondary energy products. A primary energy product is extracted or captured directly from natural resources, such as crude oil, firewood, natural gas or coal. This process is called primary production. Secondary energy products (such as electricity or motor gasoline) are produced as a result of a transformation process, either from a primary or from a different secondary energy product. Final consumers can use primary (for example natural gas for heating) or secondary energy products (such as motor gasoline to fill up their car tank).
Electricity production
From source to switch
Renewables and fossil fuels come top in in electricity production in the EU
In 2022 in the EU, 23% of the was which came from various sources. and were the leading sources in electricity production (both 39%) ahead of nuclear power plants (22%).
Among renewable sources, the highest share of electricity came from wind turbines (15%), followed by hydropower plants (10%), solar power (8%) and biofuels (5%).
The sources of electricity production vary among the EU countries. In 2022, the highest shares of fossil fuels in electricity production were in recorded in Malta (87%), Cyprus (83%) and Poland (79%), while nearly 63% came from nuclear power plants in France, followed by Slovakia (60%). In Denmark, 54% of electricity production came from wind energy, while 55% in Latvia came from hydro power plants, followed by Austria (54%). The highest shares of both biofuels (27%) and solar in electricity production (23%) were in Luxembourg.
Electricity and gas prices
In order to compare prices of electricity and gas among the EU countries, national prices have been converted into euro. Exchange rate fluctuations can influence prices expressed in euro for non-euro area countries.
Highest electricity prices, for households, in the Netherlands, Belgium and Romania
In the first half of 2023, household electricity prices, including taxes and levies, were highest in the Netherlands (€47.5 per 100 kWh), Belgium (€43.5) and Romania (€42), while the lowest prices were recorded in Bulgaria (€11) and Hungary (€12).
The share of taxes and levies in the electricity price was largest in Poland (49%) and Cyprus (38%), while it was lowest in Ireland (−82%) and Luxembourg (−50%), where the values were negative due to subsidies and allowances given to household consumers.
For non-household consumers, electricity prices (excluding VAT and other recoverable taxes and levies) ranged from €33 per 100 kWh in Romania to €9.5 per 100 kWh in Finland.
Gas prices for non-household consumers highest in Sweden and Finland
In the first half of 2023, natural gas prices for household consumers, including taxes and levies, were highest in the Netherlands (€25 per 100 kWh) and (€22), and lowest in Hungary (€3) and Croatia (€4).
The share of taxes and levies in gas price was highest in Denmark (40%) and the Netherlands (36%), while it was lowest in Luxembourg (−71%) and Latvia (−14%).
Natural gas prices for non-household consumers (excluding VAT and other recoverable taxes and levies) were highest in Sweden and Finland (€12 per 100 kWh both), and lowest in Belgium (€6) and Croatia (€7).
For more information
Energy flows
An energy balance presents energy products (solid fuels, oil and petroleum products, gas, renewable energies, nuclear heat, electricity, etc.) of a country and their production, transformation, and consumption by different types of economic actors (industry, transport, etc.). It allows users to see the total amount of energy extracted from the environment, traded, transformed, and used by end-users.
Energy balances can be graphically represented through flow diagrams (also called Sankey diagrams), which allow users to visualise the interrelation of energy commodities in a more illustrative and intuitive way. These flows can be combined, split and traced through a series of events or processing stages.
The Sankey energy tool is based on a series of black nodes connected by flows. The nodes represent events or processes (imports, final energy consumption, etc.) while the flows in different colours represent energy products. The width of each stream in the flow represents the amount of energy (fuel) in the flow.
Click on the link below to open the tool and build your own diagram!

For more information
Energy and environment
This section presents data on greenhouse gas emissions, energy efficiency and renewable energy.
23% of energy consumed in the EU in 2022 came from renewables.
Greenhouse gas emissions
Climate change is a threat to sustainable development. After years of extensive research, the scientific community have agreed that man-made are the dominant cause of the Earth’s average temperature increases for over the past 250 years (IPCC, 2014). Man-made GHG emissions are primarily a by-product of burning of fuels in power plants, cars, or homes. Farming and waste decaying in landfills are also sources of GHG emissions.
EU greenhouse gas emissions declined steadily from 2010 to 2014, then rose slightly until 2017 after which they dropped again, but in 2021 emissions increased by 5% compared with 2020.
In 2021, EU GHG emissions were 3.5 billion tonnes of CO2 equivalent, which is 28% lower than in the reference year 1990. The agreed target for 2030 is a 55% reduction and for 2050 a 100% reduction (net zero emissions). For 2040 the Commission has proposed a 90% reduction as an intermediate target.
GHG emissions were below 1990 levels in 24 EU countries. The largest reductions, between 55% and 68%, were recorded in Estonia, Latvia, Lithuania, and Romania.
Shares of sectors in GHG emissions evolving
In 2021, fuel combustion by energy users (excluding transport) had the highest share (28%, was 30% in 1990) in total greenhouse gas emissions, ahead of the energy producing industries (25%, was 33% in 1990) and fuel combustion in transport (24%, was 15% in 1990).
Energy efficiency
One of the priorities of the energy union strategy is to increase energy efficiency, mainly by cutting the EU’s overall energy use and managing energy in a more cost-effective way. Improving energy efficiency helps to achieve energy savings, protect the environment, mitigate climate change and reduce the EU's reliance on external suppliers of oil and gas.
In concrete terms, using less energy means reducing , which is the total domestic energy demand, and , which is the energy actually consumed by end users, not including what the energy sector needs itself as well as transformation and distribution losses.
Energy consumption down in 2022
In 2022, primary energy consumption reached 1 260 (Mtoe). This is 2.0% higher than in 2020, when consumption reached its lowest level due to the impact of the pandemic, but still the second-lowest level since 2005 (the first year for which data are available). The 2022 level is 11.7% away from the EU 2030 target (no more than 1 128 Mtoe primary energy consumption).
Also, final energy consumption decreased in 2022 (to 922 Mtoe, −2.7% compared with 2021), to the lowest level since 2014, except the year 2020, which was impacted by the pandemic. The 2022 level is 9.0% away from the 2030 target (no more than 846 Mtoe).
For more information
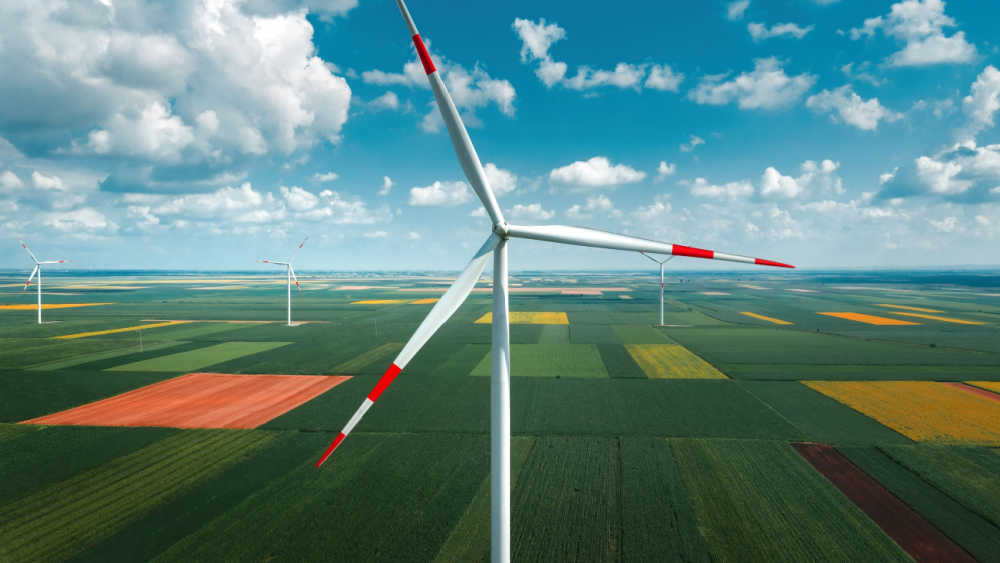
Renewable energy
From wind to watts
Steady growth in the share of renewables in energy consumption
The in the EU was 9.6% in 2004, 16.7% in 2013 and 23.0% in 2022. The only year with a decrease was 2021, when the COVID-19 restrictions linked to the pandemic were lifted which had a significant effect. The current EU target is to reach 42.5% renewables by 2030.
Sweden had by far the highest share of renewables in energy consumption (66.0%) in 2022, ahead of Finland (47.9%) and Latvia (43.3%). The lowest proportions of renewables were recorded in Ireland (13.1%), Malta (13.4%) and Belgium (13.8%). Differences stem partly from variations in the endowment with natural resources, mostly in the potential for building hydropower plants and in the availability of biomass.
EU policies
The European Green Deal is the ambitious EU climate policy that aims for Europe to become the first climate neutral continent by 2050.
In particular, reaching this target will require action by all sectors of the economy, including investing in environmentally friendly technologies, decarbonising the energy sector, ensuring buildings are more energy efficient and rolling out cleaner forms of private and public transport.
The energy union is the main energy policy instrument to deliver the changes necessary to decarbonise our energy system. The goal of the energy union is to give EU consumers – households and businesses – secure, sustainable, competitive, and affordable energy.
To ensure that policies and measures at various levels are consistent, complementary and sufficiently ambitious, the energy union adopted a strong governance mechanism, based on integrated national energy and climate plans.
The annual state of the energy union report monitors progress made to bring about the transition to a low-carbon, secure and competitive economy. It also highlights the issues where further attention is needed.
Using reliable high-quality data to monitor the policy targets under the European Green Deal and the energy union packages, will enhance the credibility of EU energy policy.
Glossary
Bunkers include all dutiable petroleum products loaded aboard a vessel for consumption by that vessel. International maritime bunkers describe the quantities of fuel oil delivered to ships of all flags that are engaged in international navigation. It is the fuel used to power these ships. International navigation may take place at sea, on inland lakes and waterways, and in coastal waters. International maritime bunkers do not include fuel oil consumption by:
- ships engaged in domestic navigation (whether a vessel is engaged in domestic or international navigation is determined only by the ship's port of departure and port of arrival — not by the flag or nationality of the ship)
- fishing vessels
- military forces.
Combined heat and power describes the simultaneous production of both useful heat (that can be used, for example, in industrial processes or city heating schemes) and electricity in a single process or unit.
Derived heat is used for warming spaces and for industrial processes and is obtained by burning combustible fuels like coal, natural gas, oil, renewables (biofuels) and wastes, or also by transforming electricity to heat in electric boilers or heat pumps.
City heating, also known as district heating, is the distribution of heat through a network to one or several buildings using hot water or steam produced centrally, often from co-generation plants, from waste heat from industry, or from dedicated heating systems.
Electricity denotes the set of physical phenomena related to electrical charges.It allows energy to be stored and transferred, or to be consumed through electrical appliances. It has a very wide range of applications in almost all kinds of human activities ranging from industrial production, household use, agriculture or commerce and it is normally used for running machines, lighting, and heating.
The energy imports dependency rate shows the proportion of energy that an economy must import. It is defined as net energy imports (imports minus exports) divided by gross inland energy consumption plus fuel supplied to international maritime bunkers, expressed as a percentage. A negative dependency rate indicates a net exporter of energy while a dependency rate more than 100 % indicates that energy products have been stocked.
Energy intensity measures the energy consumption of an economy and its energy efficiency. It is the ratio between gross inland consumption of energy and gross domestic product (GDP). Gross inland consumption of energy is calculated as the sum of gross inland consumption of five energy types: coal, electricity, oil, natural gas and renewable energy sources. The GDP figures are taken at constant prices to avoid the impact of inflation. Since gross inland consumption is measured in kilograms of oil equivalent and GDP in EUR 1 000, this ratio is measured in kgoe per EUR 1 000.
Energy end user categories include private households, agriculture, industry, road transport, air transport (aviation), other transport (rail, inland navigation) and services.
Final energy consumption is the total energy consumed by end users, such as households, industry, and agriculture. It is the energy which reaches the final consumer's door and excludes that which is used by the energy sector itself. Final energy consumption excludes energy used by the energy sector, including for deliveries, and transformation. It also excludes fuel transformed in the electrical power stations of industrial auto-producers and coke transformed into blast-furnace gas where this is not part of overall industrial consumption but of the transformation sector. Final energy consumption in 'households, services, etc.' covers quantities consumed by private households, commerce, public administration, services, agriculture, and fisheries.
Fossil fuel is a generic term for non-renewable natural energy sources such as coal, natural gas and oil that were formed from plants and animals (biomass) that existed in the geological past (for example, hundreds of millions of years ago). Fossil fuels are carbon-based and currently meet most human energy requirements.
Gas includes mostly natural gas and derived gases.
A gigajoule, abbreviated as GJ, is a unit of measurement of energy consumption: a gigajoule is equal to one thousand million joules.
Gigawatt-hour, abbreviated as GWh, is a unit of energy representing one billion (1 000 000 000) watt-hours and is equal to one million kilowatt-hours. Gigawatt-hours are often used as a measure of the output of large electricity power stations.
Greenhouse gases constitute a group of gases contributing to global warming and climate change. The Kyoto Protocol, an environmental agreement adopted by many of the parties to the United Nations Framework Convention on Climate Change (UNFCCC) in 1997 to curb global warming, covers six greenhouse gases: carbon dioxide (CO2), methane (CH4), nitrous oxide (N2O), and the so-called F-gases (hydrofluorocarbons and perfluorocarbons) and sulphur hexafluoride (SF6). Converting them to carbon dioxide (or CO2) equivalents makes it possible to compare them and to determine their individual and total contributions to global warming.
Gross available energy means the overall supply of energy for all activities on the territory of the country. It includes energy needs for energy transformation (including generating electricity from combustible fuels), support operations of the energy sector itself, transmission and distribution losses, final energy consumption (industry, transport, households, services, agriculture, ...) and the use of fossil fuel products for non-energy purposes (e.g., in the chemical industry). It also includes fuel purchased within the country that is used elsewhere (e.g., international aviation, international maritime bunkers and, in the case of road transport “fuel tourism”).
Gross inland energy consumption, sometimes abbreviated as gross inland consumption, is the total energy available of a country or region. It represents the quantity of energy necessary to satisfy inland consumption of the geographical entity under consideration. Gross inland energy consumption covers consumption by the energy sector itself; distribution and transformation losses; final energy consumption by end users; 'statistical differences' (not already captured in the figures on primary energy consumption and final energy consumption). Gross inland consumption does not include energy (fuel oil) provided to international maritime bunkers. It is calculated as primary production plus recovered products, net imports and variations of stocks minus maritime bunkers.
Gross electricity generation or gross electricity production refers to the process of producing electrical energy. It is the total amount of electrical energy produced by transforming other forms of energy, for example nuclear or wind power. It is commonly expressed in gigawatt-hours (GWh). Total gross electricity generation covers gross electricity generation in all types of power plants. The gross electricity generation at plant level is defined as the electricity measured at the outlet of the main transformers, i.e., including the amount of electricity used in the plant auxiliaries and in the transformers.
Kilogram(s) of oil equivalent, usually abbreviated as kgoe, is a normalised unit of energy. By convention, it is equivalent to the approximate amount of energy that can be extracted from one kilogram of crude oil (41 868 kilojoules = 41.868 megajoules). It is a standardised unit and may be used to compare the energy from different sources.
Kilowatt-hours, abbreviated as kWh, is a unit of energy representing one thousand watt-hours. Kilowatt-hours are often used as a unit when measuring domestic energy consumption.
Net electricity production or net electricity generation is equal to gross electricity production (or generation) minus the consumption of power stations' auxiliary services.
Nuclear heat is the thermal energy produced in a nuclear power plant (nuclear energy). It is obtained from the nuclear fission of atoms, usually of uranium and plutonium.
Primary production of energy is any extraction of energy products in a useable form from natural sources. This occurs either when natural sources are exploited (for example, in coal mines, crude oil fields, hydro power plants) or in the fabrication of biofuels. Transforming energy from one form into another, such as electricity or heat generation in thermal power plants (where primary energy sources are burned), or coke production in coke ovens, is not primary production.
Renewable energy sources, also called renewables, are energy sources that replenish (or renew) themselves naturally. Renewable energy sources include the following:
Ambient heat (heat pumps): heat pumps that are driven by electricity or other supplementary energy, to extract (stored) energy from the air, the ground or the water and converts/transfers this into energy to be used elsewhere (e.g., to heat space via underfloor heating systems and/or water in domestic buildings).
Biomass (solid biofuels): organic, non-fossil material of biological origin, which may be used for heat production or electricity generation. It includes charcoal; wood and wood waste; black liquor, bagasse, animal waste and other vegetal materials and residuals.
Biogases: gases composed principally of methane and carbon dioxide produced by anaerobic fermentation of biomass, or by thermal processes. It includes landfill gas; sewage sludge gas; other biogases from anaerobic digestion; biogases from thermal processes.
Liquid biofuels are liquid fuels from a non-fossil biological origin and a renewable energy source, to be distinguished from fossil fuels. Biofuels can be split up into four categories: bio gasoline, biodiesel, bio jet kerosene (aviation fuel) and other liquid biofuels.
Renewable waste: portion of waste produced by households, industry, hospitals, and the tertiary sector which is biological material collected by local authorities and incinerated at specific installations.
Hydropower: the electricity generated from the potential and kinetic energy of water in hydroelectric plants (the electricity generated in pumped storage plants is not included).
Geothermal energy: the energy available as heat from within the Earth’s crust, usually in the form of hot water or steam.
Wind energy: the kinetic energy of wind converted into electricity in wind turbines.
Solar energy: solar radiation exploited for solar heat (hot water) and electricity production.
Tide, wave, ocean: mechanical energy derived from tidal movement, wave motion or ocean current and exploited for electricity generation.
Solid fuels are fossil fuels covering various types of coals and solid products derived from coals. They consist of carbonised vegetable matter and usually have the physical appearance of a black or brown rock.
Tonne(s) of oil equivalent, abbreviated as toe, is a normalised unit of energy. By convention it is equivalent to the approximate amount of energy that can be extracted from one tonne of crude oil (41 868 megajoules = 41.868 gigajoules). It is a standardised unit and may be used to compare the energy from different sources.
Total fuels is the sum of all energy products and is composed of the following fuel families: Solid fuels (coal), total petroleum products (crude oil and derived petroleum products), gas, nuclear heat, derived heat, renewable energies, electricity and waste (non-renewable).
Total petroleum products are fossil fuels (usually in liquid state) and include crude oil and all products derived from it (e.g., when processed in oil refineries), including motor gasoline, diesel oil, fuel oil, etc.
Waste (non-renewable) consists of materials coming from combustible industrial, institutional, hospital and household wastes such as rubber, plastics, waste fossil oils and other similar types of wastes, which can be either solid or liquid.
About this publication
Shedding light on energy in the EU is an interactive publication released by Eurostat, the statistical office of the European Union.
Information on data
Data shown in the visualisations are linked directly to the online database (and thus accordingly updated) up to the reference period mentioned in the title of each visualisation. The accompanying text (and the notes in the 3rd visualisation) were finalised during the first half of March 2024 and reflect the data situation at that moment in time. The energy interactive tools referred to in the publication are continuously updated.
For more information
- Thematic section on energy statistics
- Database on energy statistics
- Statistics Explained articles on energy
- Statistics 4 beginners articles on energy statistics
- Interactive energy visualisation tools
Contact
If you have questions on the data, please contact Eurostat user support.
Copyright and re-use policy
This publication should not be considered as representative of the European Commission’s official position.
© European Union, 2024
The reuse policy of European Commission documents is implemented based on Commission Decision 2011/833/EU of 12 December 2011 on the reuse of Commission documents (OJ L 330, 14.12.2011, p. 39).
Except otherwise noted, the reuse of this document is authorised under a Creative Commons Attribution 4.0 International (CC-BY 4.0) licence. This means that reuse is allowed provided appropriate credit is given and any changes are indicated.
For any use or reproduction of elements that are not owned by the European Union, permission may need to be sought directly from the respective rightholders. The European Union does not own the copyright in relation to the following elements:
Cover photo: © Nuttsue / Shutterstock.com
Energy sources: © Kampan / Shutterstock.com
Energy consumption: © Milos Muller / Shutterstock.com
Energy and environment: © Bits And Splits / Shutterstock.com
For more information, please consult our page on copyright notice and free re-use of data.
Identifiers
Catalogue number: KS-FW-24-002-EN-Q
ISBN 978-92-68-12833-6
ISSN 2600-3368
doi:10.2785/88627
Share