Trade in goods with Ukraine in 2024

In 2024, the EU exported €42.8 billion in goods to Ukraine and imported €24.5 billion, resulting in a €18.3 billion trade surplus.
When compared with 2023, this was an increase in exports and imports of 9.4% and 7.0%, respectively.
Source dataset: ds-045409
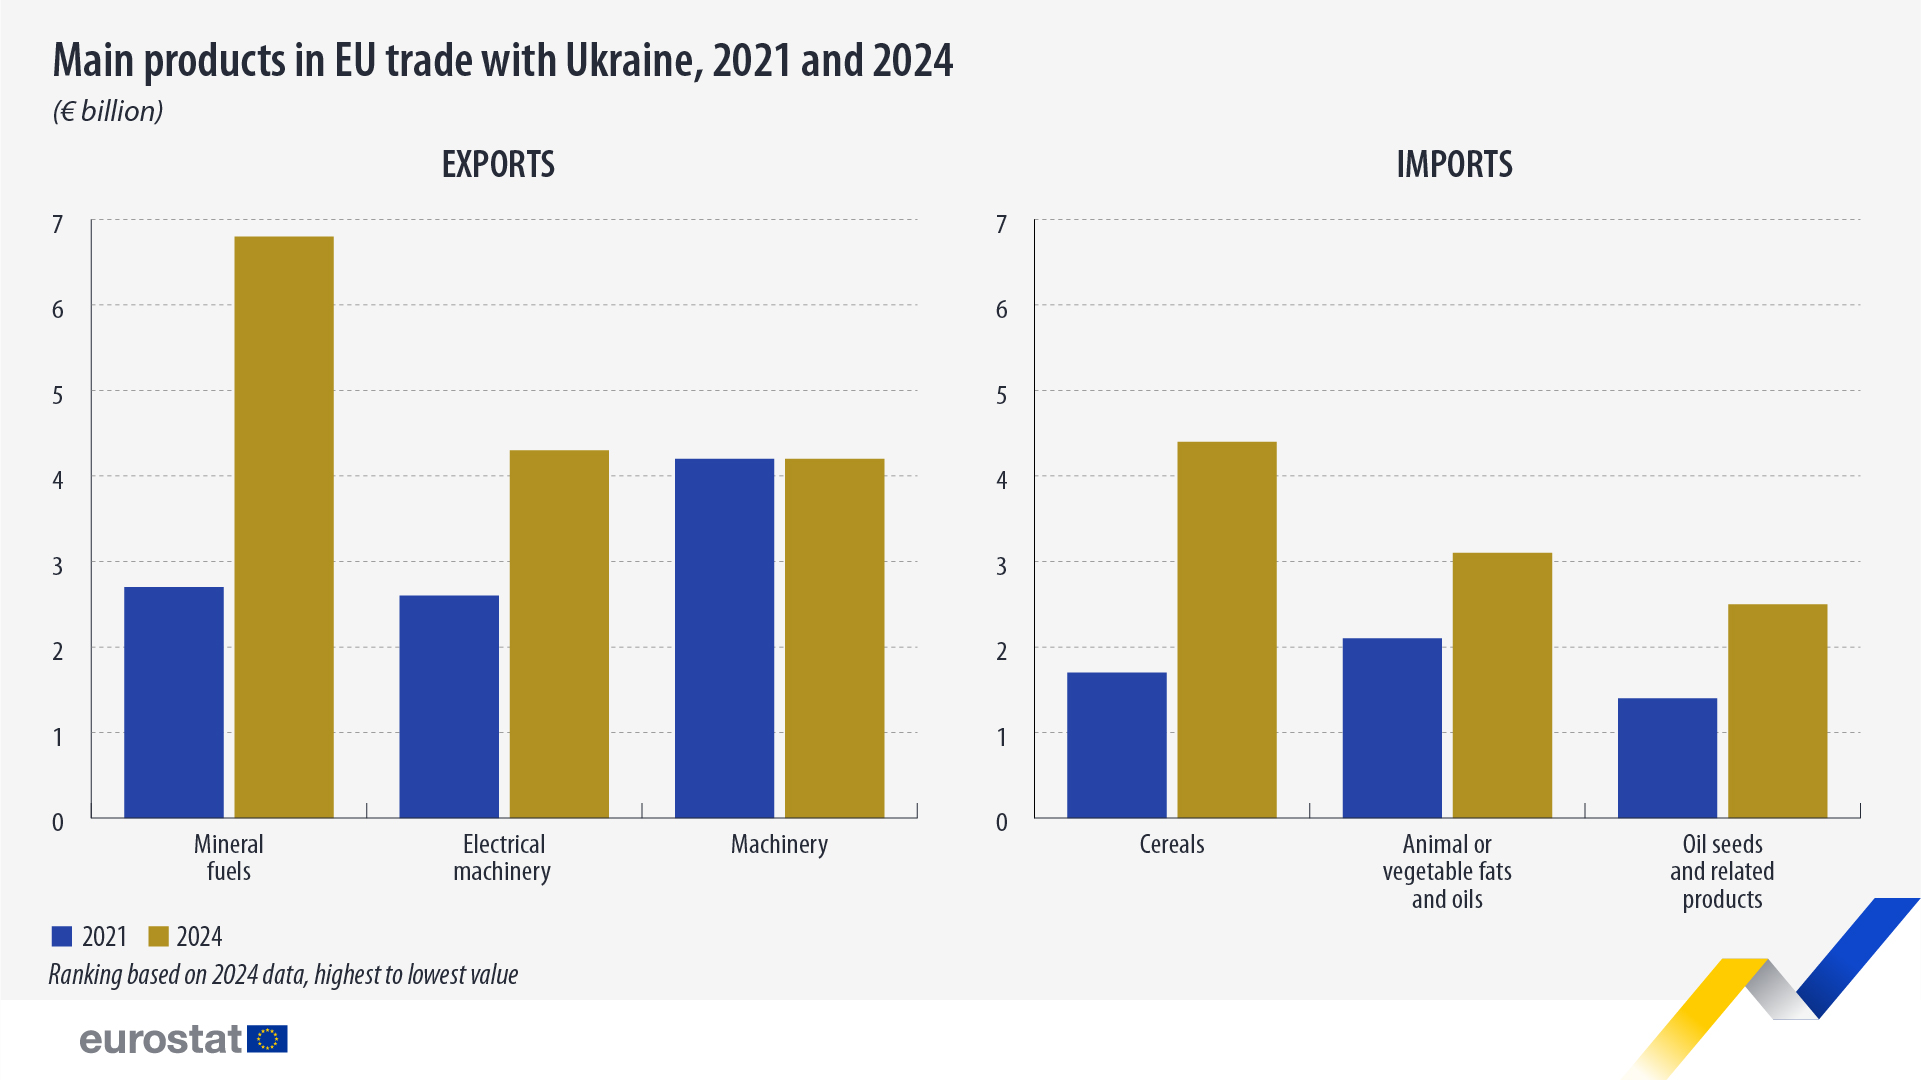
The main export products were mineral fuels (€6.8 billion), electrical machinery (€4.3 billion) and machinery (€4.2 billion). Compared with 2021, exports grew the most for mineral fuels (up €4.1 billion) as Ukraine’s previous imports of these fuels from Russia and Belarus declined and were partly replaced by imports from the EU.
The key product groups imported from Ukraine in 2024 included agricultural products such as cereals, worth €4.4 billion, animal or vegetable fats and oils (€3.1 billion) and oil seeds and related products (€2.5 billion).
Compared with 2021, imports of cereals increased by €2.7 billion, animal or vegetable fats and oils by €1.0 billion, and oil seeds and related products by €1.1 billion.

Source dataset: ds-045409
For more information
- Statistics Explained article on EU trade with Ukraine - latest developments
- Thematic section on international trade in goods
- Thematic section on Ukraine
- Database on international trade in goods
Methodological notes
- The harmonised system (HS) codes used for exports were 27 (mineral fuels), 85 (electrical machinery) and 84 (machinery).
- The HS codes used for imports were 10 (cereals), 15 (animal or vegetable fats and oils) and 12 (oil seeds and related products).
If you have any queries, please visit our contact us page.

