EU imports of energy products continued to drop in Q2 2023

Following a strong increase in energy imports in the EU between 2021 and 2022, the scenario is different in 2023, with imports dropping for the second quarter in a row when compared with the same period in the previous year.
In the second quarter of 2023, compared with the same quarter of 2022, EU imports decreased by 39.4% in terms of value and 11.3% in terms of net mass (weight expressed in tonnes). These results follow declines of 26.5% and 6.1%, respectively, in the first quarter of this year.
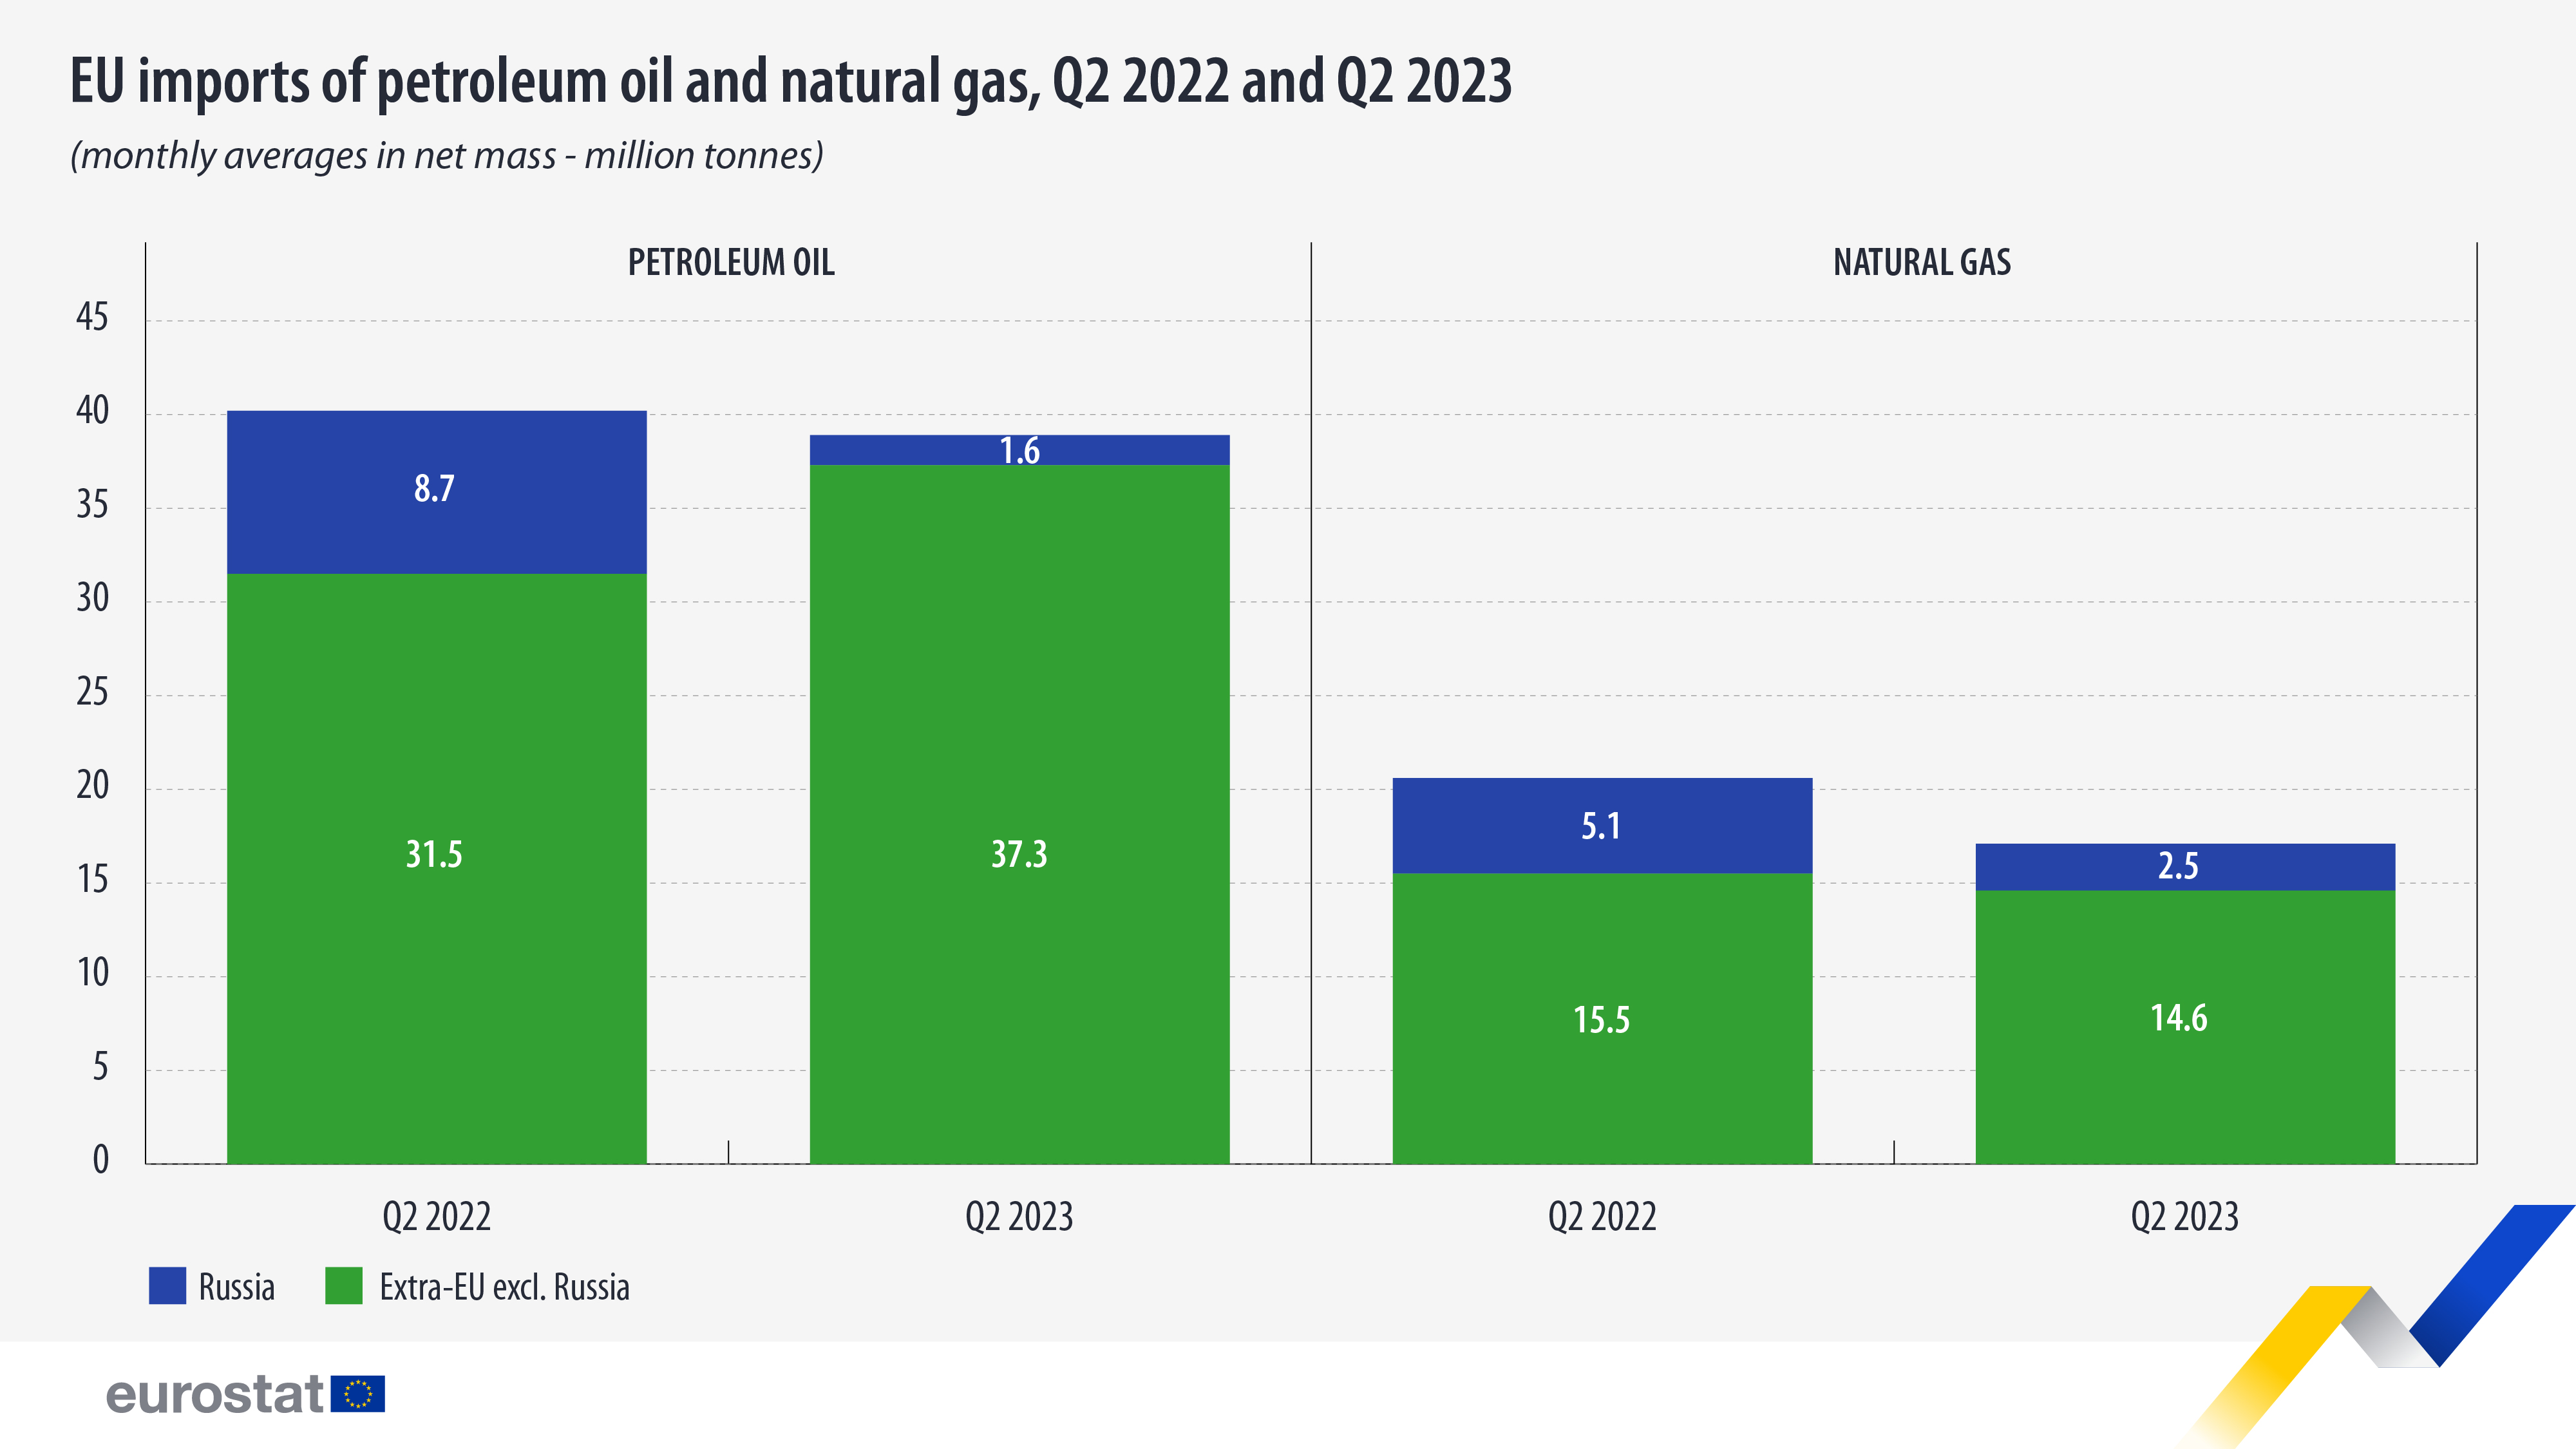
In terms of net mass, Russia's shares in the EU imports of petroleum oils and natural gas have been decreasing continuously over time since the second quarter of 2022. Petroleum oils imports from Russia fell from a monthly average of 8.7 million tonnes in the second quarter of 2022 to 1.6 million tonnes in the second quarter of this year (-82%), but, in contrast, the imports from the extra-EU partners except Russia increased by 5.8 million tonnes, from 31.5 million to 37.3 million tonnes.
Russia's share in total EU imports of petroleum oils was 4.0% in the second quarter of 2023, a staggering difference from the 21.6% share recorded in the same quarter of last year.
Source dataset: Comext and Eurostat estimates
EU imports of natural gas dropped significantly (-17% in terms of net mass) in the second quarter of 2023, compared with the same quarter in 2022. This reduction could have been triggered by the EU reduction plan, where EU countries committed to reducing gas consumption.
Natural gas imports from Russia fell from a monthly average of 5.1 million tonnes in the second quarter of 2022 to 2.5 million tonnes in the second quarter of 2023.
Diversification of suppliers ongoing
Russia’s war of aggression against Ukraine led the EU to implement several packages of sanctions, which directly and indirectly affected the trade of oils and natural gas. The impact is now visible in a growing diversification of energy suppliers.
Regarding petroleum oil, the EU ban on seaborne imports of Russian crude oil entered into force on 5 December 2022, followed by the embargo on refined oil products as of 5 February 2023, which impacted results in the first and second quarters of 2023.
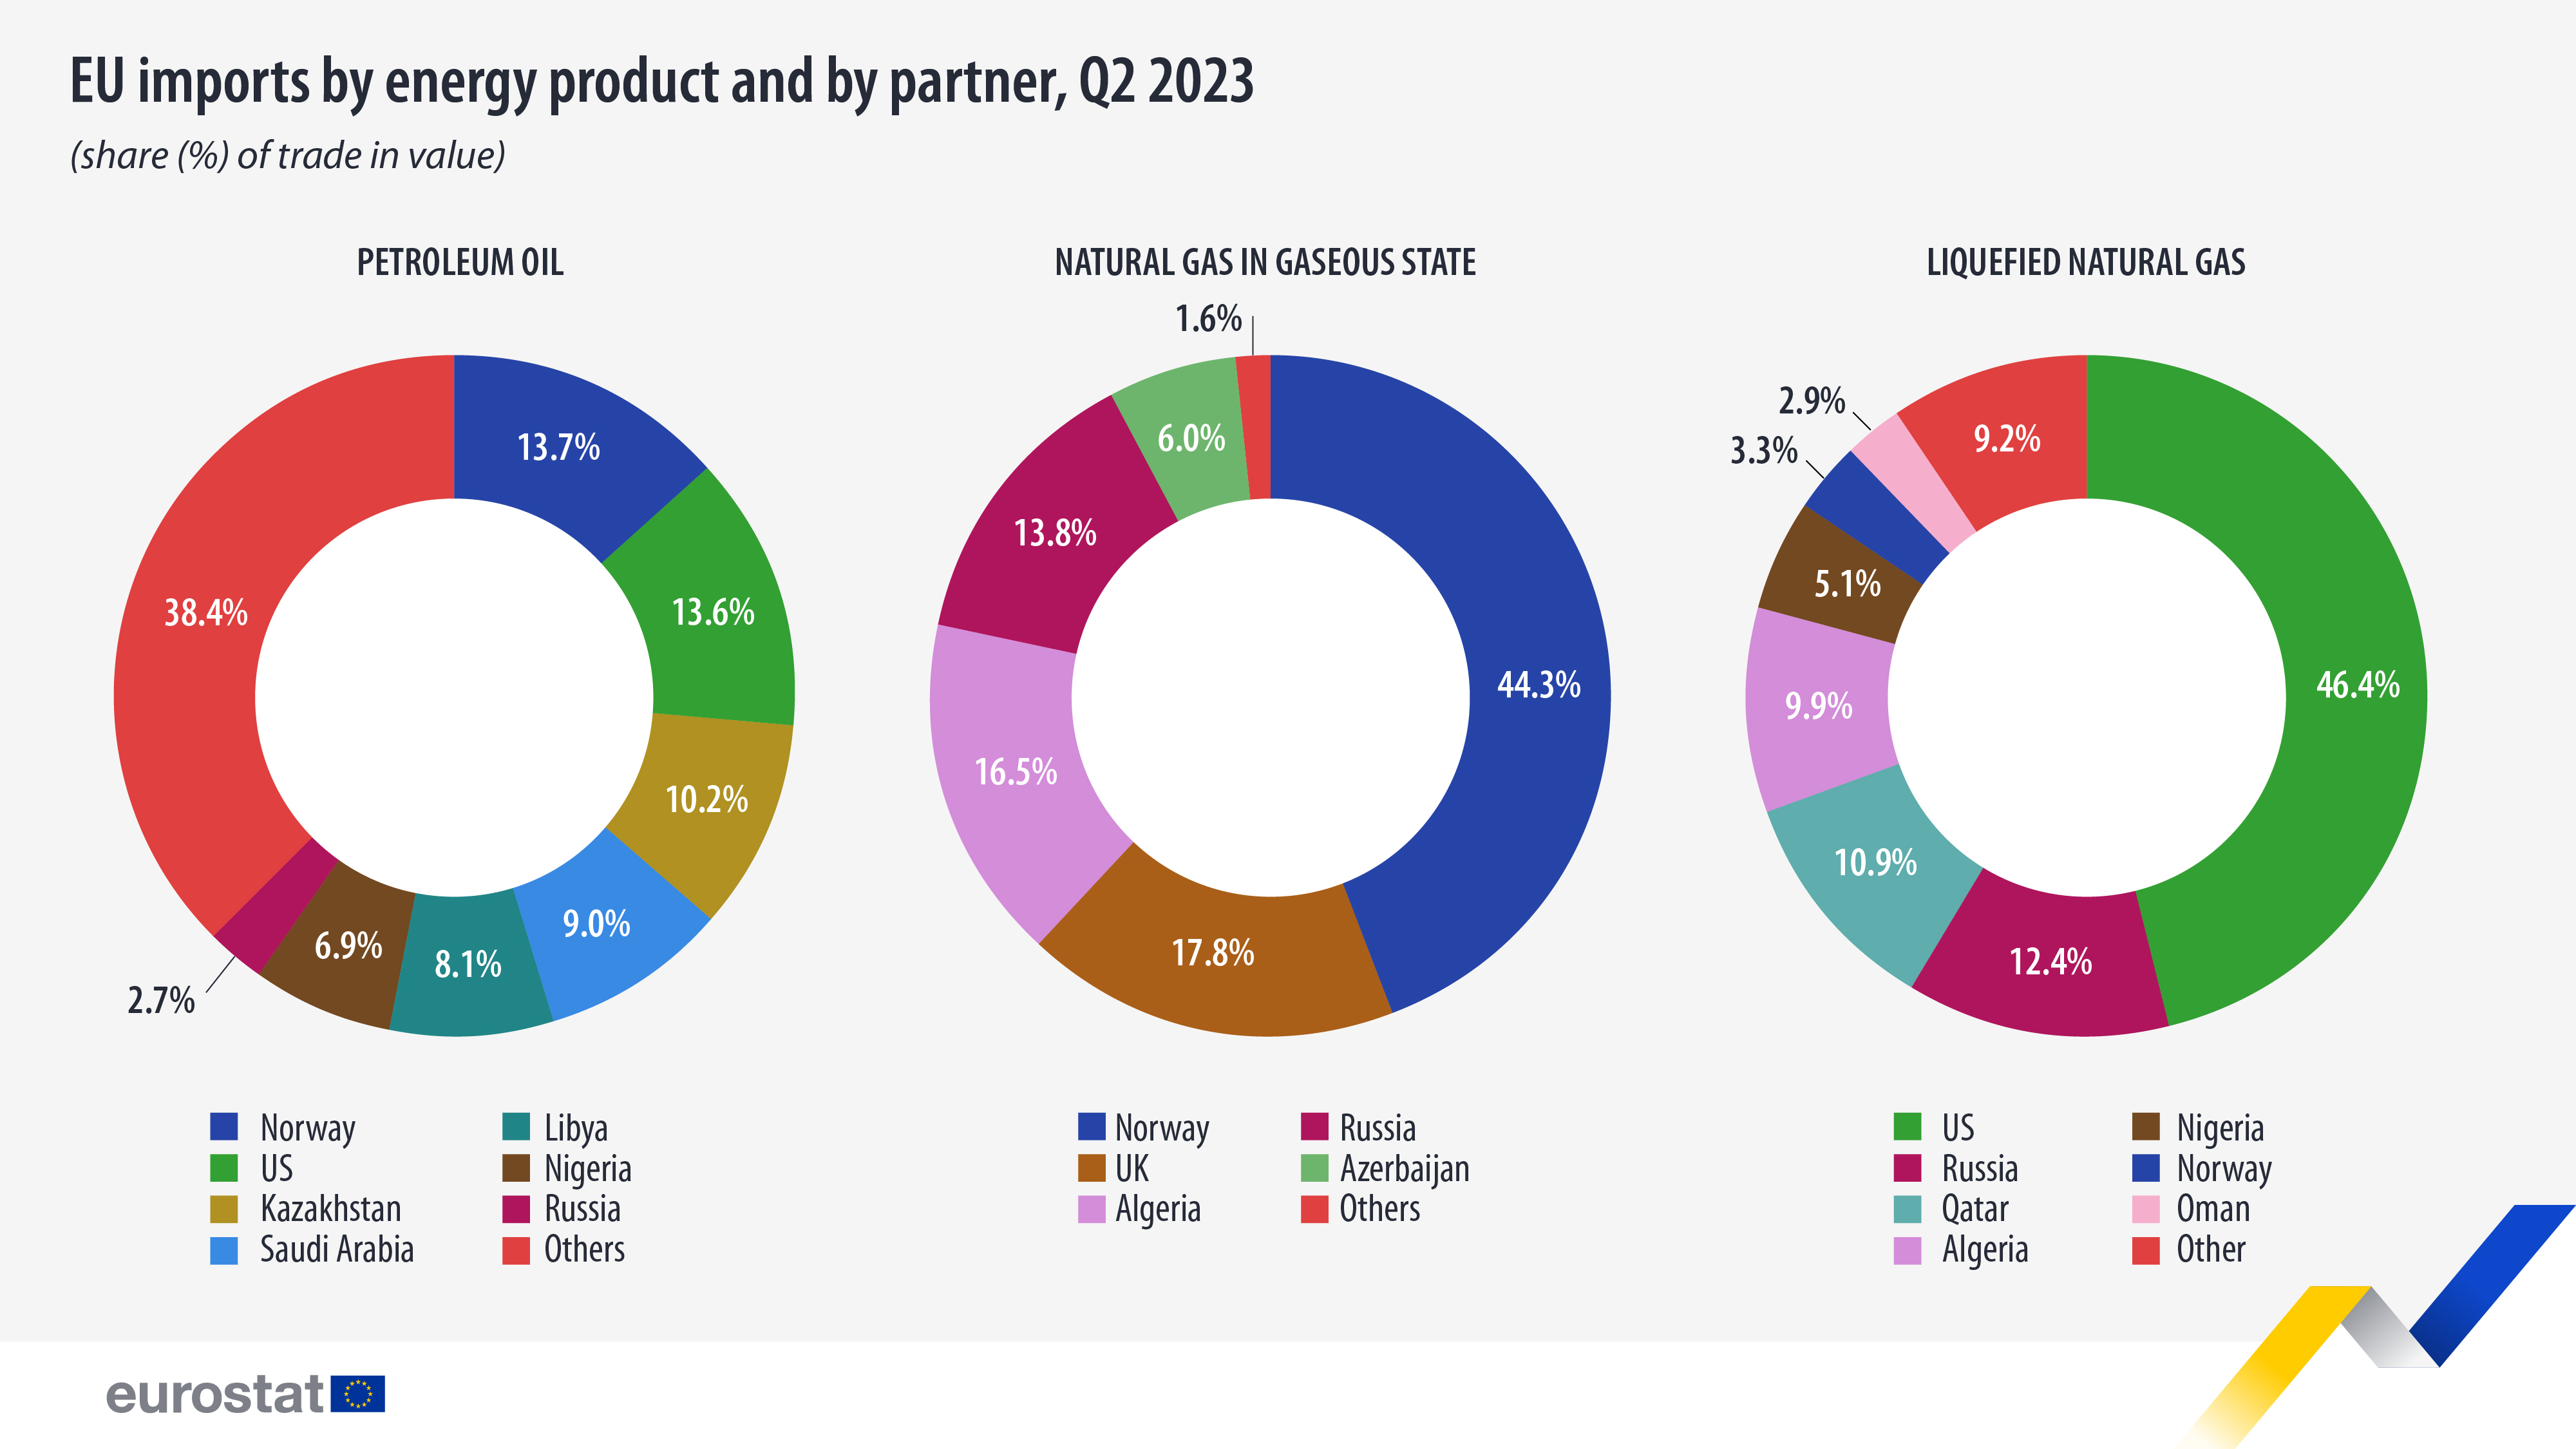
In the second quarter of 2022, Russia was the leading supplier of petroleum oils, with a share of 15.9% of total EU imports. In the second quarter of 2023, Russia ranked only 12th, with a share of 2.7%, down 13.2 percentage points (pp) compared with 2022.
By contrast, Norway (+3.5 pp up to 13.7%), Kazakhstan (+3.2 pp up to 10.2%), the United States (+2.1 pp up to 13.6%) and Saudi Arabia (+2.3 pp up to 9.0%) saw their share increase over the same period, and Libya became an important partner, accounting for 8.1% of EU petroleum oil imports.
Source dataset: Comext and Eurostat estimates
The situation was similar for natural gas in a gaseous state, with Russia’s share dropping by 14.5 pp to 13.8% of total EU imports, while the shares of Algeria (+9.3 pp) and Norway (+6.2 pp) increased significantly. In the second quarter of 2023, Norway was the EU’s top supplier with a share of 44.3% of total EU imports, followed by the United Kingdom (17.8%) and Algeria (16.5%).
As far as liquefied natural gas is concerned, the United States remains by far the EU's leading supplier in the second quarter of 2023, with a share of 46.4% in total EU imports, followed by Russia (12.4%), Qatar (10.9%), Algeria (9.9%) and Nigeria (5.1%). Among these suppliers, only Algeria and Nigeria saw their share increase (+5.2 pp and +1.0 pp respectively) compared to the second quarter of 2022. By contrast, the respective shares of the United States, Russia and Qatar fell by -2.8 pp, -2.7 pp and -1.1 pp respectively. Norway and Oman became important suppliers, with shares of 3.3% and 2.9% respectively.
For more information
- Statistics Explained article on EU imports of energy products - latest developments
- Thematic section on international trade in goods
- Database on international trade in goods
If you have any queries, please visit our contact us page.


