Preliminary 2022 data for energy show mixed trends

The last three years have been marked by many uncertainties and fluctuations when it comes to energy. After the COVID-19-related lockdowns and restrictive measures in 2020, many EU countries experienced a rebound in economic activity in 2021. However, natural gas prices skyrocketed in the second half of 2021, and 2022 revealed to be an even more challenging year, as sanctions on imports from Russia, disturbances in natural gas supply and concerns regarding potential gas shortages affected the market and led to spikes in natural gas prices. All these in combination with the lower output of nuclear power plants, significantly affected the European electricity market, where prices also spiked.
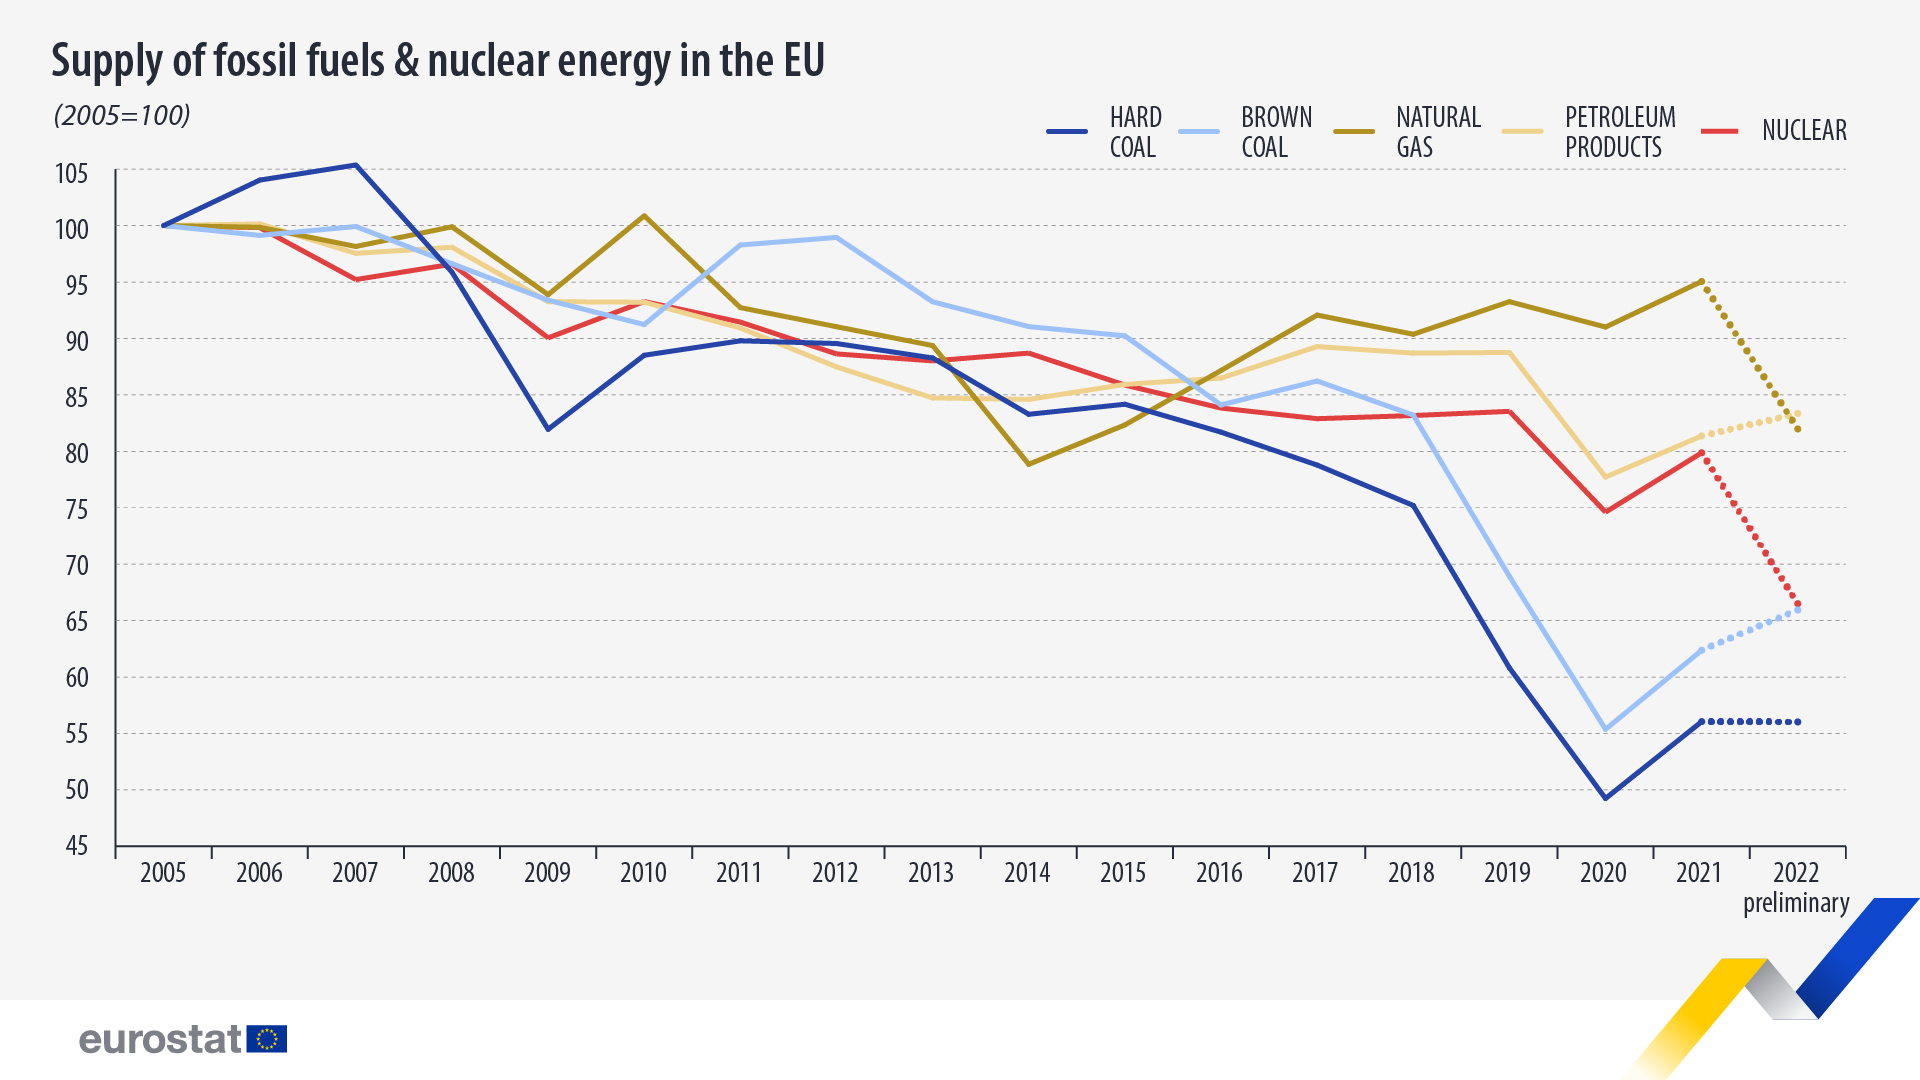
Preliminary data for 2022 show that, after 2021 saw an increase in the supply of all products (hard and brown coal, natural gas, petroleum products and nuclear), there was a sharp drop in 2022 for nuclear and natural gas, while brown coal and petroleum products continued increasing. Hard coal was almost at the same level as in 2021, showing only a very slight decrease.
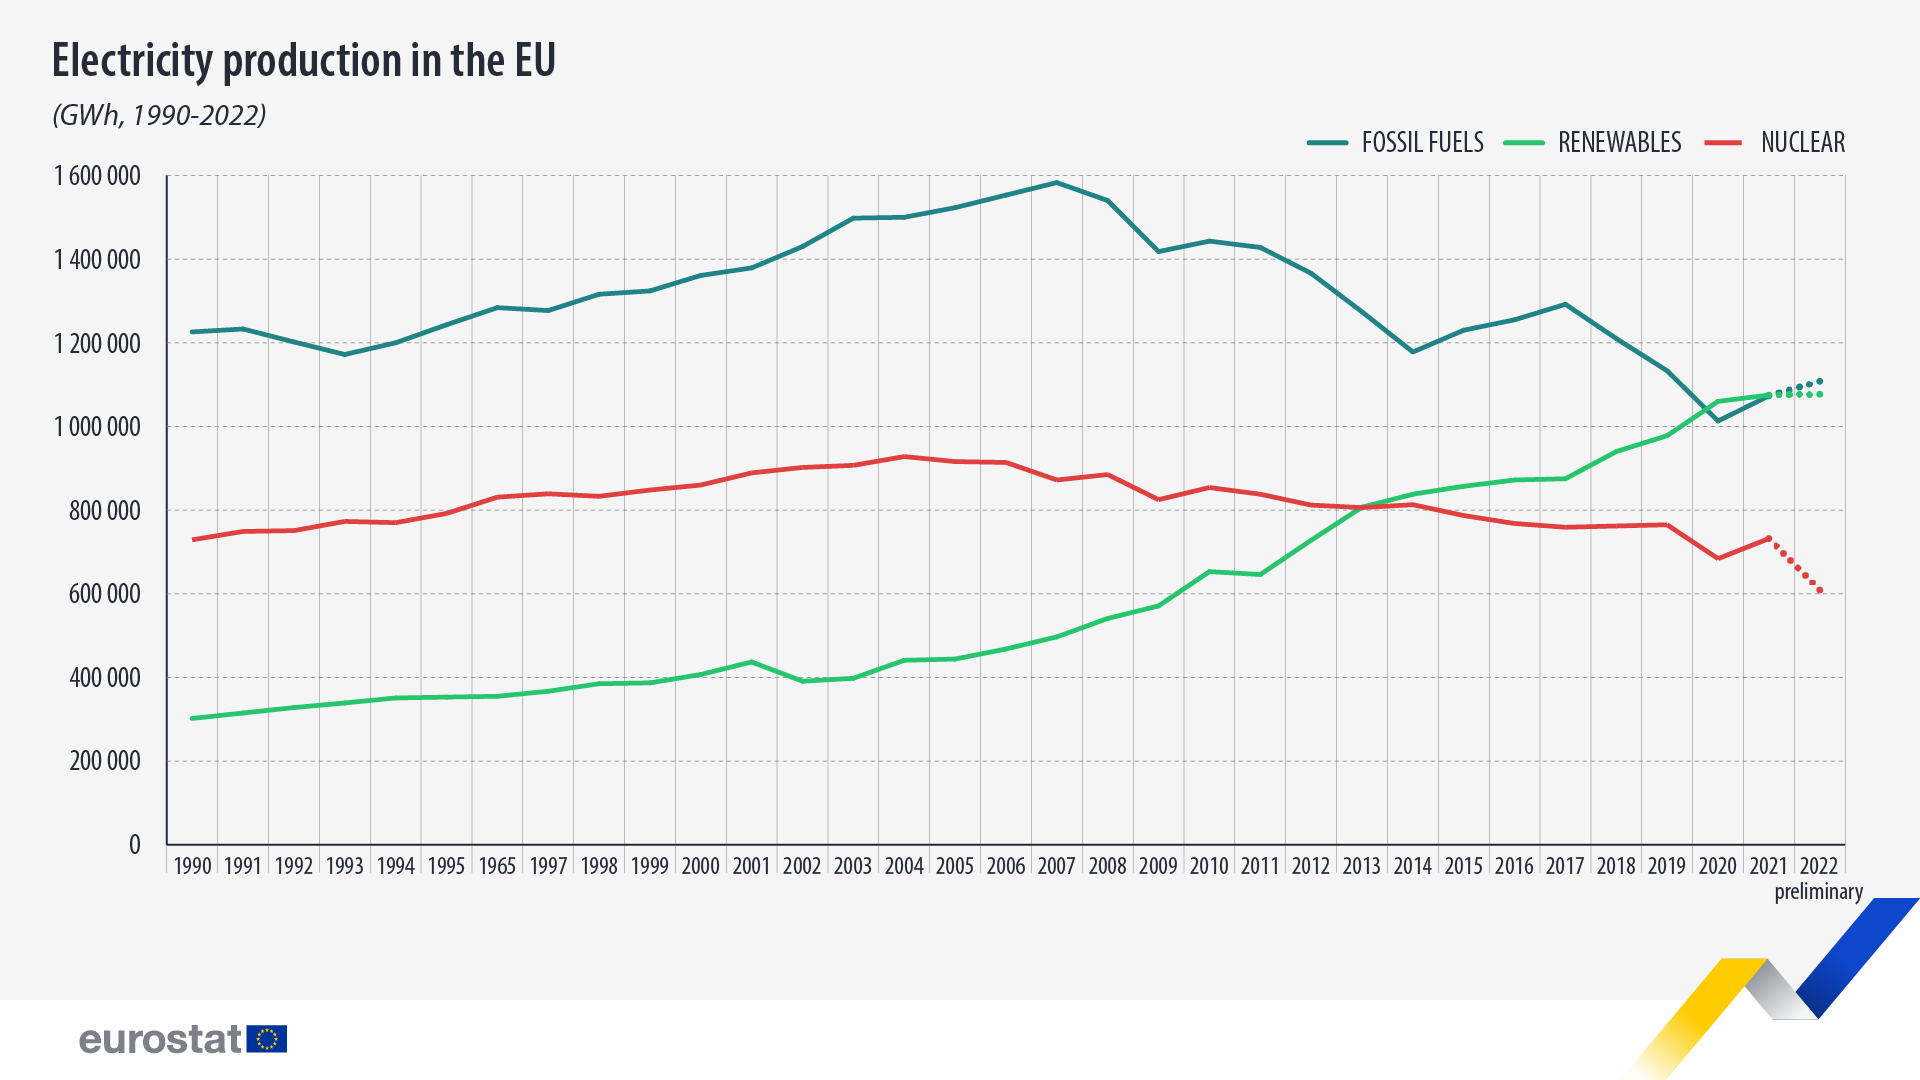
The decrease in the supply of nuclear energy due to prolonged maintenance and shutdowns, as well as in hydropower generation connected to the exceptionally hot and dry summer of 2022 in many EU countries, affected the main sources of electricity production.
This information comes from data on energy published by Eurostat recently. The article presents a handful of findings from the more detailed Statistics Explained article on energy production and imports.
Source dataset: nrg_cb_sff, nrg_cb_gas , nrg_cb_oil and nrg_ind_pehnf
Following a massive fall of 11.9% in 2020 in the supply of petroleum products, the opposite has been registered in the following years: +3.2% in 2021 and +4.5% in 2022 (compared with the previous year). In 2022, the supply of oil and petroleum products totalled 535 142 thousand tonnes, still below the 2019 pre-pandemic value of 563 116 thousand tonnes.
In terms of natural gas, supply decreased to 13.7 million terajoules (TJ), the lowest value since 2014. This is a drop of 13.8% compared with 2021 and -10.8% compared with the 2017-2019 average and is coherent with the successful 15% voluntary gas demand reduction initiative introduced in August 2022 (please see methodological note). Natural gas net imports totalled 13.4 million TJ, up by 1.1% compared with 2021, and domestic production reached 1.6 million TJ, maintaining a decreasing trend since 2017 (3.1 million TJ).
In 2022, the supply of brown coal increased by 5.7% to 294 776 thousand tonnes, while the supply of hard coal decreased slightly by 0.1%, remaining at a 165 080 thousand tonnes level similar to 2021. Compared with the 2017-2019 average, in 2022, the supply of brown coal was down 17.0%, and hard coal dropped 21.8%.
Gross electricity production down 3% in 2022
Preliminary data for 2022 indicate that gross electricity production in the EU decreased by 3.0% compared with 2021. When looking at the 2017-2019 average, there was an even clearer drop of 3.9%.
After renewable energy sources surpassed fossil fuels in electricity generation in 2020, fossil fuels have recovered ground and were the leading source of electricity in 2022 for the second year in a row. Fossil fuels generated 1.11 million Gigawatt-hour (GWh) in 2022, +3.3% compared with 2021, while renewables generated 1.08 million GWh (+0.1%).
Electricity generation from certain solid fossil fuels continued to increase in 2022, following a surge in 2021: other bituminous coal was up 10.0%, and lignite was up 6.7%.
On the renewables side, preliminary 2022 data show the biggest increases in electricity produced from solar photovoltaic energy (+29.3%) and wind (+8.9%). On the other hand, electricity generation from hydro (-17.7%) and solid biofuels (-7.4%) decreased in the same reference period. Due to these diverging trends, electricity generation from renewable sources remained relatively stable compared to 2021.
Compared with 2021, the output of nuclear power plants dropped by 16.7% to 609 thousand GWh, and compared with the 2017-2019 average, it decreased by 20.1%.
Source dataset: nrg_ind_pehcf and nrg_ind_pehnf
For more information
- Statistics Explained article on energy production and imports
- Statistics Explained article on improved timeliness of energy statistics
- Thematic section on energy
- Database on energy
- Energy visualization tools
- Shedding light on energy in the EU — 2022 interactive edition
- European Green Deal
Methodological note:
- The preliminary annual data that Eurostat publishes concerns energy supply. The terms supply and inland consumption can be used interchangeably since the calculated inland consumption corresponds to the supply.
- The coordinated demand reduction measures for gas and its voluntary 15% reduction target are based on monthly energy statistics, excluding biogas blended in the grid and measure the period from March to August as a 5–year average. Therefore, it is not directly comparable to the -13.8% figure that is based on annual energy statistics, includes all gases in the grid and is measured against 3 calendar years.
If you have any queries, please visit our contact us page.


