Oil import dependency down to 91.7% in 2021

After reaching a record high of 96.78% in 2020, the import dependency for the entire family of crude oil and petroleum products declined to 91.67% in 2021. This value is the second lowest since 1990, after the historical minimum of 91.66% in 1999. Any further change influenced by Russian invasion of Ukraine and the following EU policy decisions will be reflected in the 2022 data.
The import dependency registered in 2021 was the combined result of changes in net imports (-0.3%), with both imports and exports rising by +3.4% and +9.2%, and gross available energy (+5.3%). Primary production also changed (-5.7%), but it has a far lesser influence on the indicator due to its relatively low level.
The drop in dependency was also supported by the use of 20.4 Mtoe of oil stocks which was the largest yearly draw ever recorded and equivalent to 4.1 % of the gross available energy.
Crude oil import dependency also down
Specifically for crude oil, an essential primary commodity for the petrochemical industry and the production of transport fuels, the import dependency decreased for two consecutive years, standing at 95.2% in 2021, below the levels registered since 2015.
The reduction recorded in 2021 resulted from an increase in net imports (+1.6%) and gross available energy (+2.5%). Other variables, such as primary production and exports, also changed (-6.1% and -11.6%, respectively), but they have a smaller influence given their comparatively low levels. The drop in dependency was also slightly influenced by crude oil stocks' use of 4.9 Mtoe, an unusually high draw, which however was equivalent to only 1.1 % of the gross available energy.
Source dataset: nrg_ind_id
EU’s crude oil production at a new low
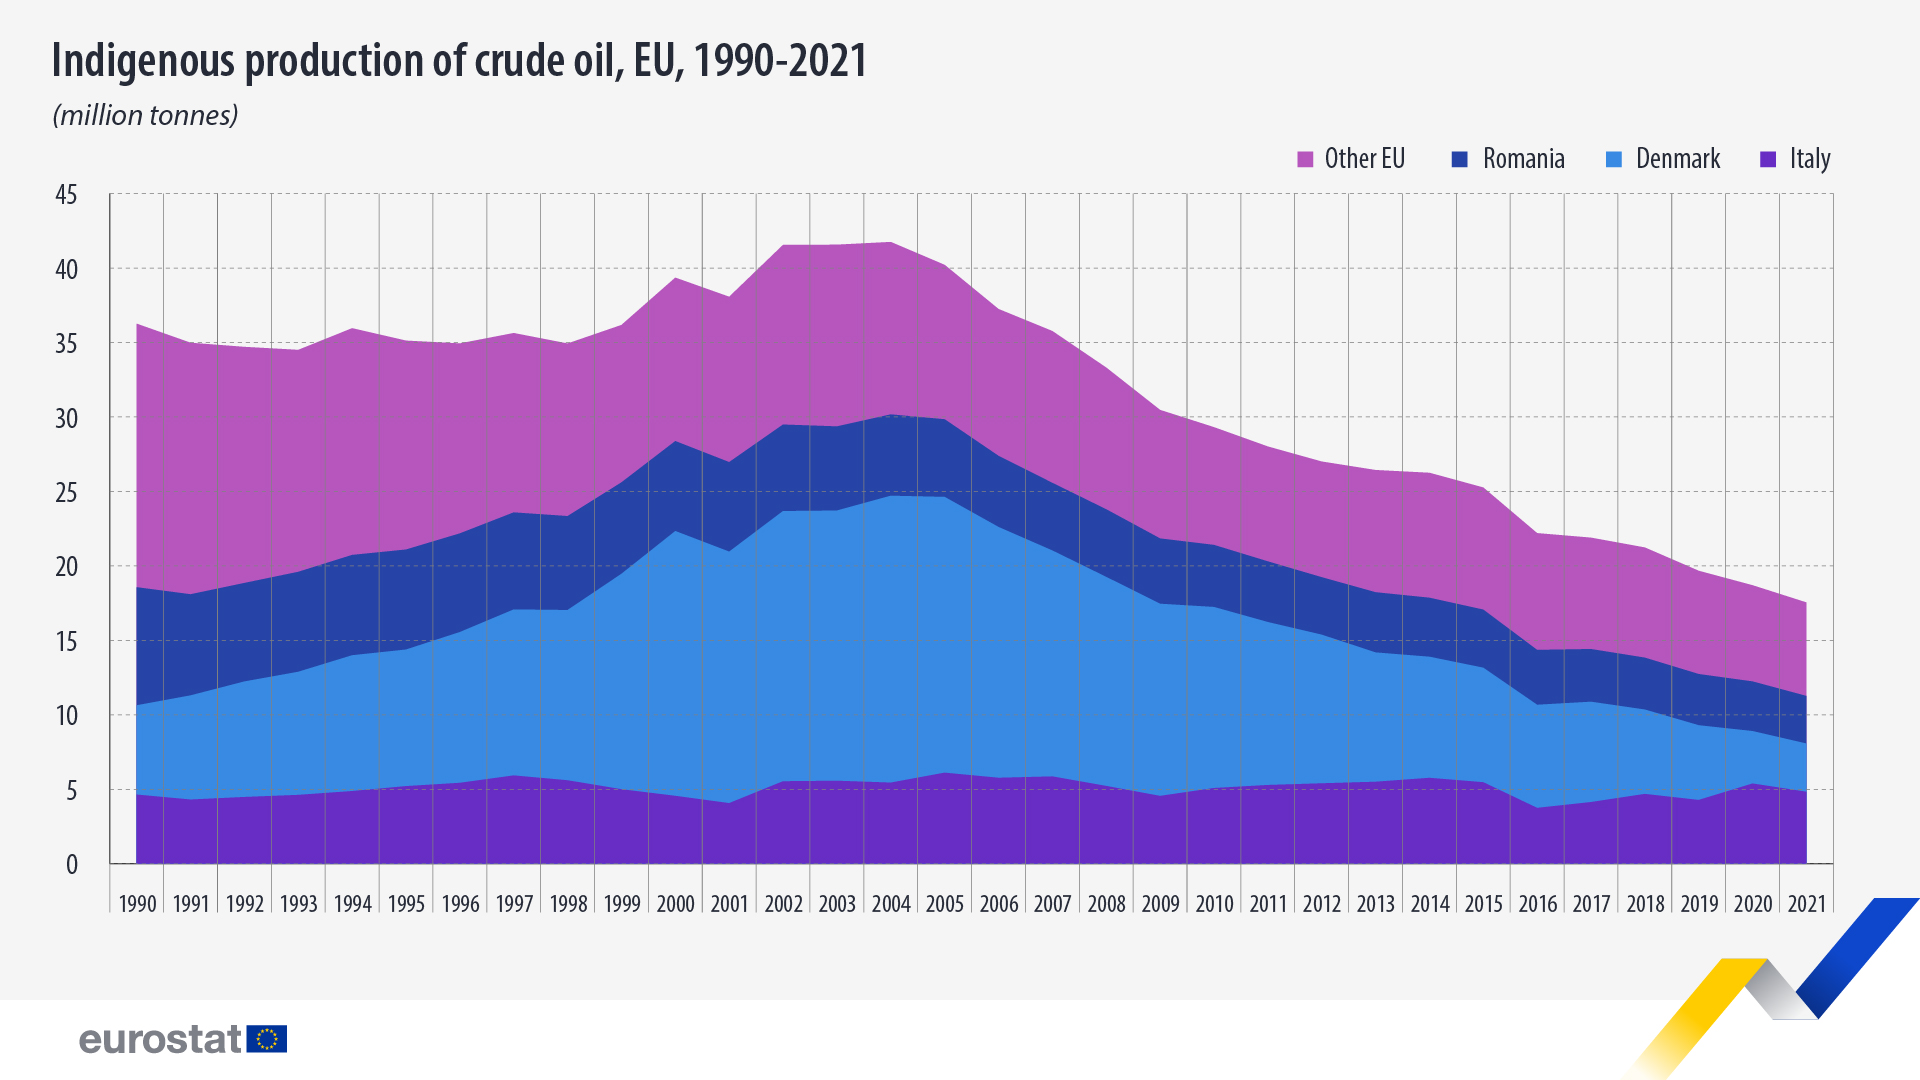
In 2021, the production of crude oil in the EU continued to decrease, reaching its lowest point at 17.5 million tonnes (Mt), 6% less than in 2020.
Between 1990 and 2004, crude oil production fluctuated but was always over 34.5 Mt, peaking in 2004 at 41.7 Mt. Almost 20 years later it decreased by more than half.
The EU’s top oil producers in 2021 were Italy (4.8 Mt), Denmark and Romania (each with 3.2 Mt). Compared with 2020, production shrunk in all three countries: -10% in Italy, -8% in Denmark, and -4% in Romania.
Source dataset: nrg_cb_oil
For more information
- Statistics Explained article on Oil and petroleum products - a statistical overview
- Thematic section on energy
- Database on energy
- Interactive publication: Shedding light on energy in the EU
- Interactive visualisations on energy
- Statistics 4 beginners on energy
- Statistics Explained articles on energy
Methodology notes:
- Import dependency on oil is calculated as the ratio of net imports (imports minus exports) to the gross available energy of crude oil and petroleum products. Positive values indicate an import dependency, while negative values indicate a net exporter country. If positive values are above 100 %, it means that imports surpass the needs of a country and that consequently stocks are being built up. Import dependency can be calculated for an aggregate of products for just one fuel.
If you have any queries, please visit our contact us page.


