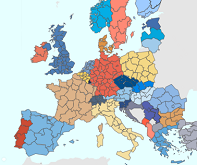
Do you want to know how your region is doing compared to other regions in your country or in the European Union (EU)? Eurostat has recently expanded its Regions and Cities home page with a lightweight tool called My Region.
With My Region you can pick a region on the map, which will then bring you to the relevant regional dashboard showing a selection of indicators including:
- Population
- Life expectancy
- Employment and unemployment rates
- Tertiary educational attainment
- Gross Domestic Product per inhabitant
- Nights spent in tourist accommodation
- Numbers of passenger cars and fatal road accidents.
For each indicator selected, My Region ranks the region in national and European contexts. Data can be viewed at different levels of regional detail, depending on the indicator and the NUTS level selected on the dashboard.
The tool is easy to use, and complements Regions and Cities Illustrated, our tool for more advanced analyses.
Did you know for instance that…
- There are more passenger cars per inhabitant registered in Valle d’Aosta/Vallée d’aoste (IT) than in any other EU region at NUTS 2 level (1.17 per inhabitant)?
- Braunschweig (Germany) has the highest share of research and development expenditure in relation to its gross domestic product among all EU NUTS 2 regions?
- Comunidad de Madrid (Spain) has the highest life expectancy at birth of all regions in Spain and in the EU, with 85.2 years?
For more information:
- Eurostat Region and Cities home page
To contact us: estat-user-support@ec.europa.eu