Tourism in 2022 approaches pre-pandemic levels

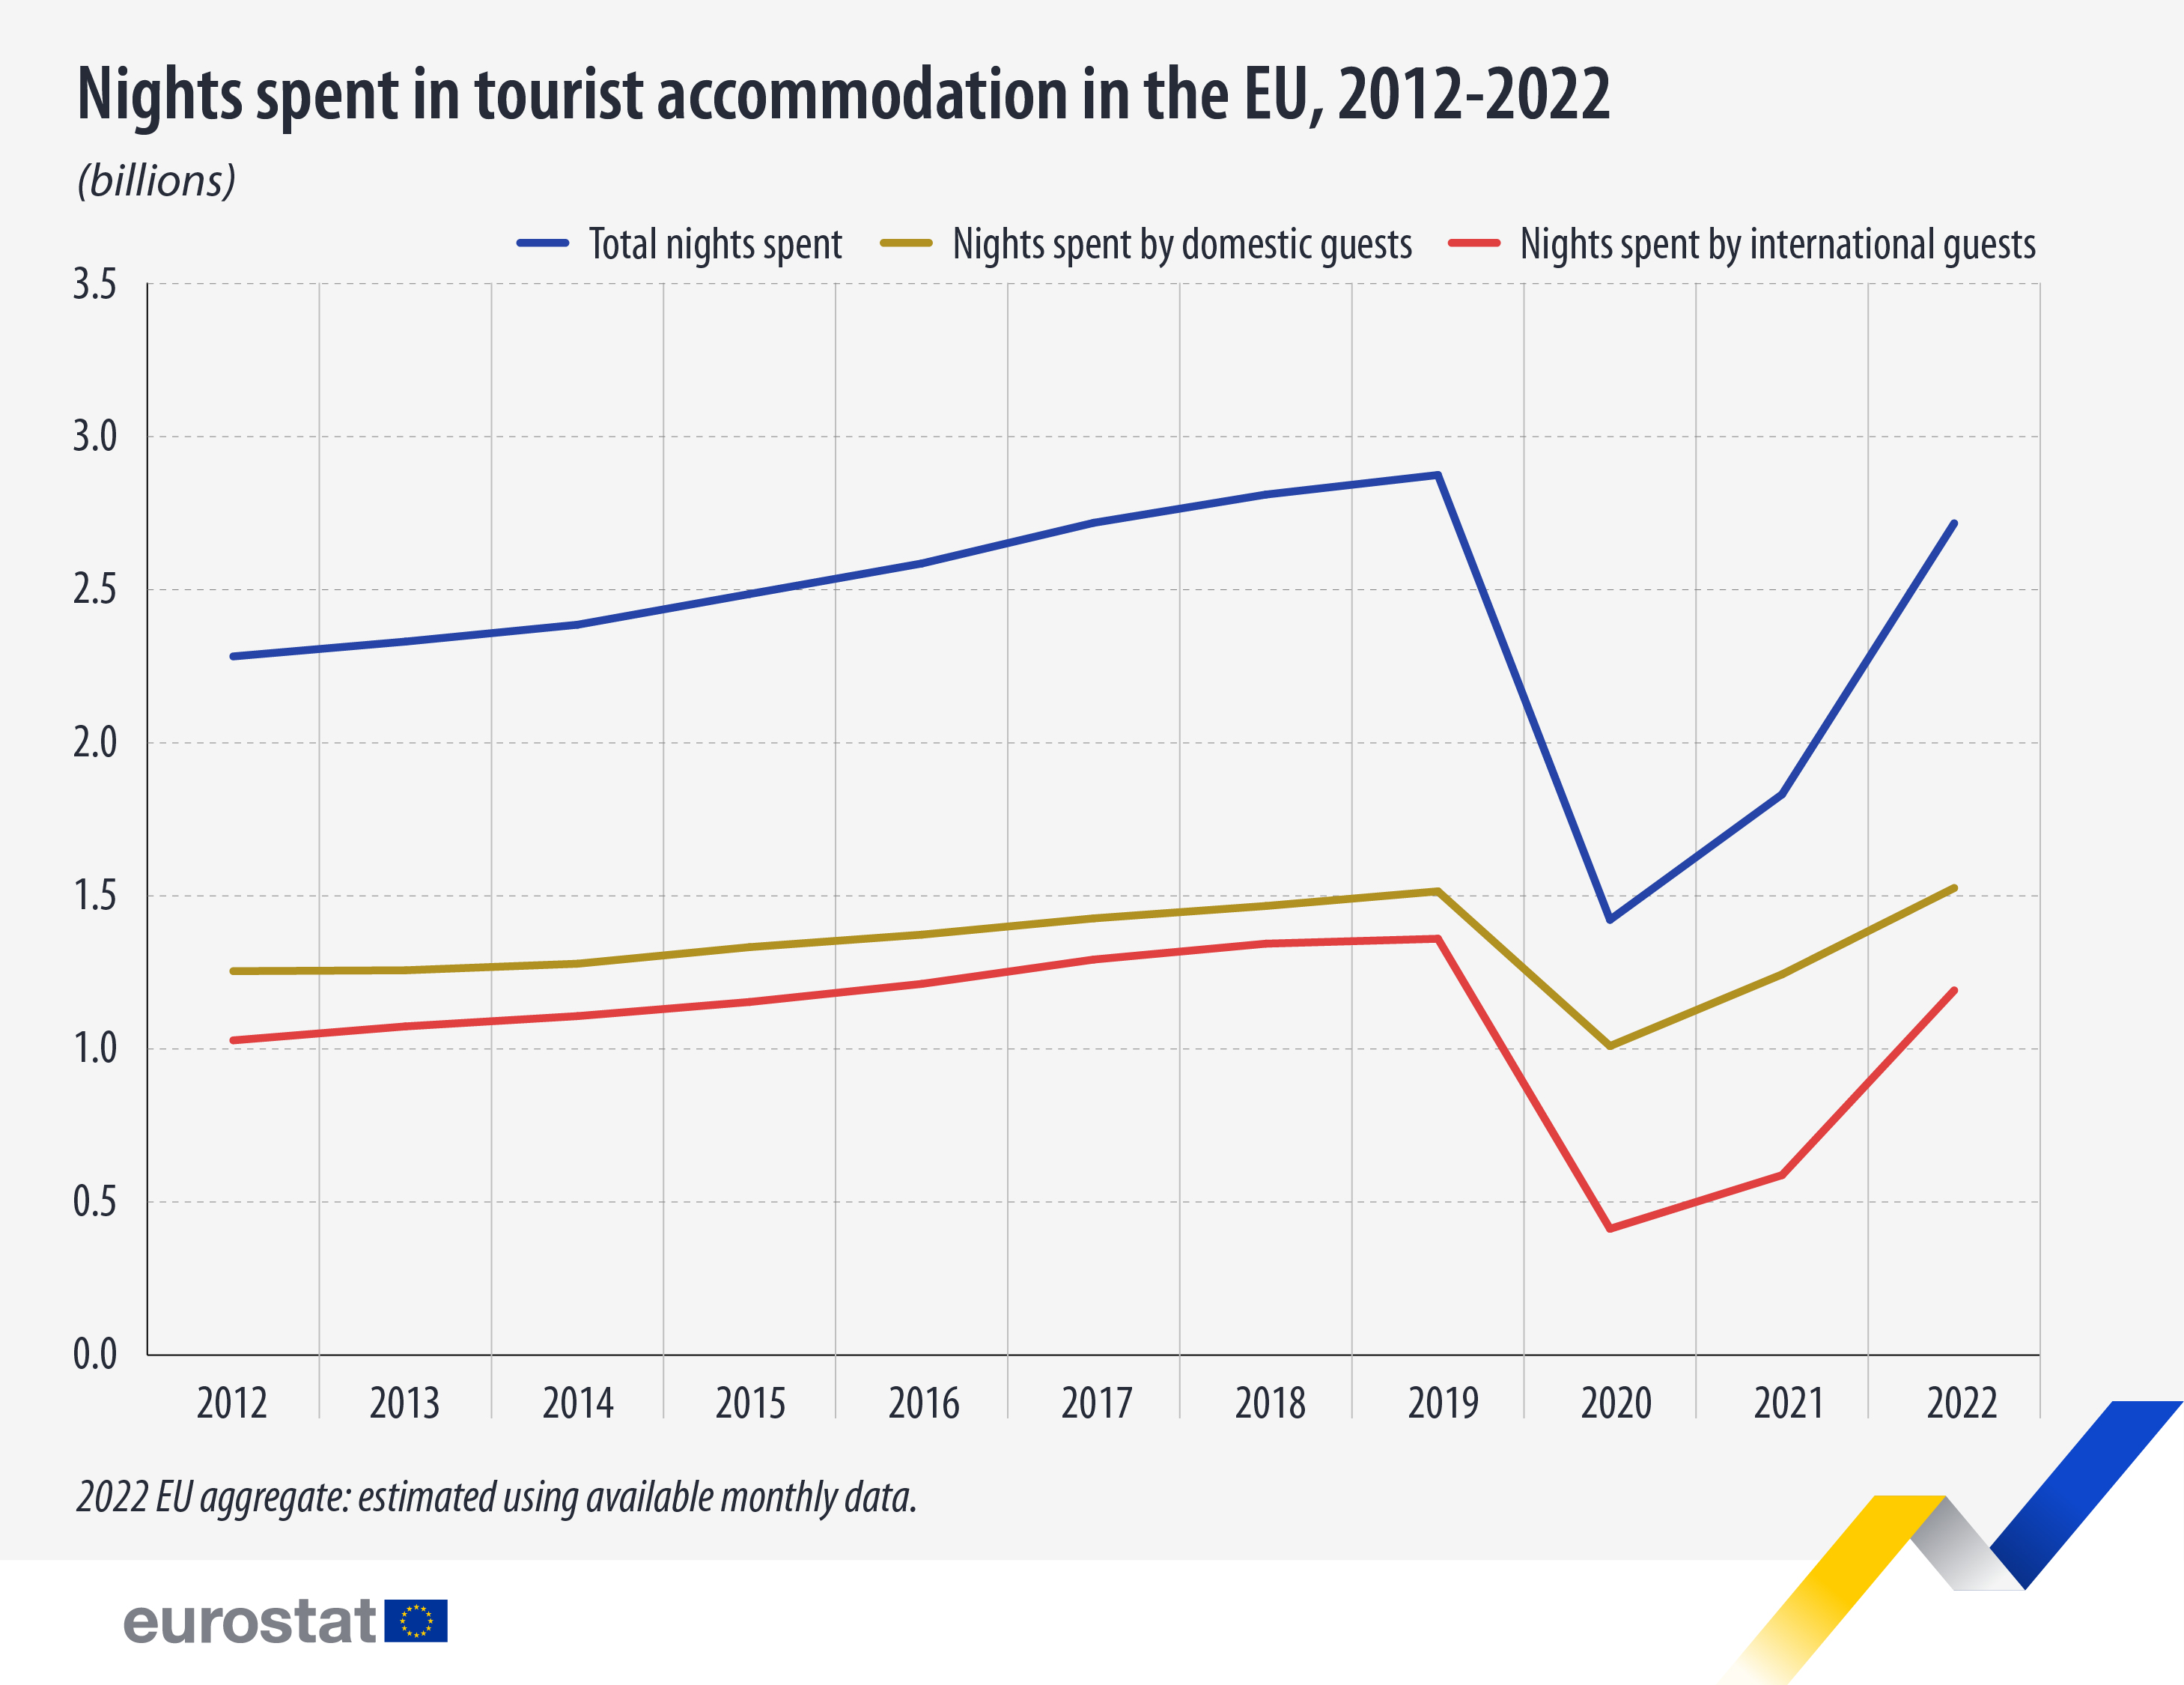
The EU tourism industry seems to be strongly rebounding from the COVID-19 pandemic. The total number of nights spent in tourist accommodation in 2022 was close to the pre-pandemic level (2.72 billion nights in 2022 compared with 2.88 billion in 2019; -5.6%). This represents substantial increases compared with the number of nights spent in 2020 and 2021 (1.42 billion in 2020, 1.83 billion in 2021; +91.1% and +48.3% in 2022, respectively).
In the course of 2022, monthly tourism figures increased continuously and finally approached the levels of the corresponding months in 2019. Compared with the pre-summer first half year of 2019 (January–June), in the same period of 2022, nights spent in tourist accommodation were down by 11.0%. Meanwhile, the period July-December closely mirrored 2019 levels of nights spent (-1.9%).
This information comes from early estimates on tourism published by Eurostat today (based on monthly January-October or November data, depending on each respective country). This article presents a handful of findings from the more detailed Statistics Explained article.
Source datasets: tour_occ_ninat and tour_occ_nim
Data for 2022 also show that nights spent by international guests have neared 2019 levels (1.19 billion nights in 2022 compared with 1.36 billion in 2019; -12.6%). This represents a strong increase compared with the number of nights spent by foreign tourists in 2020 and in 2021 (412.5 million nights in 2020, 587.8 million in 2021; +188.8% and +102.6% in 2022, respectively).
Regarding domestic travel, 2022 data show a record number of 1.53 billion nights spent, an increase of 10.9 million compared with 2019 (+0.7%).
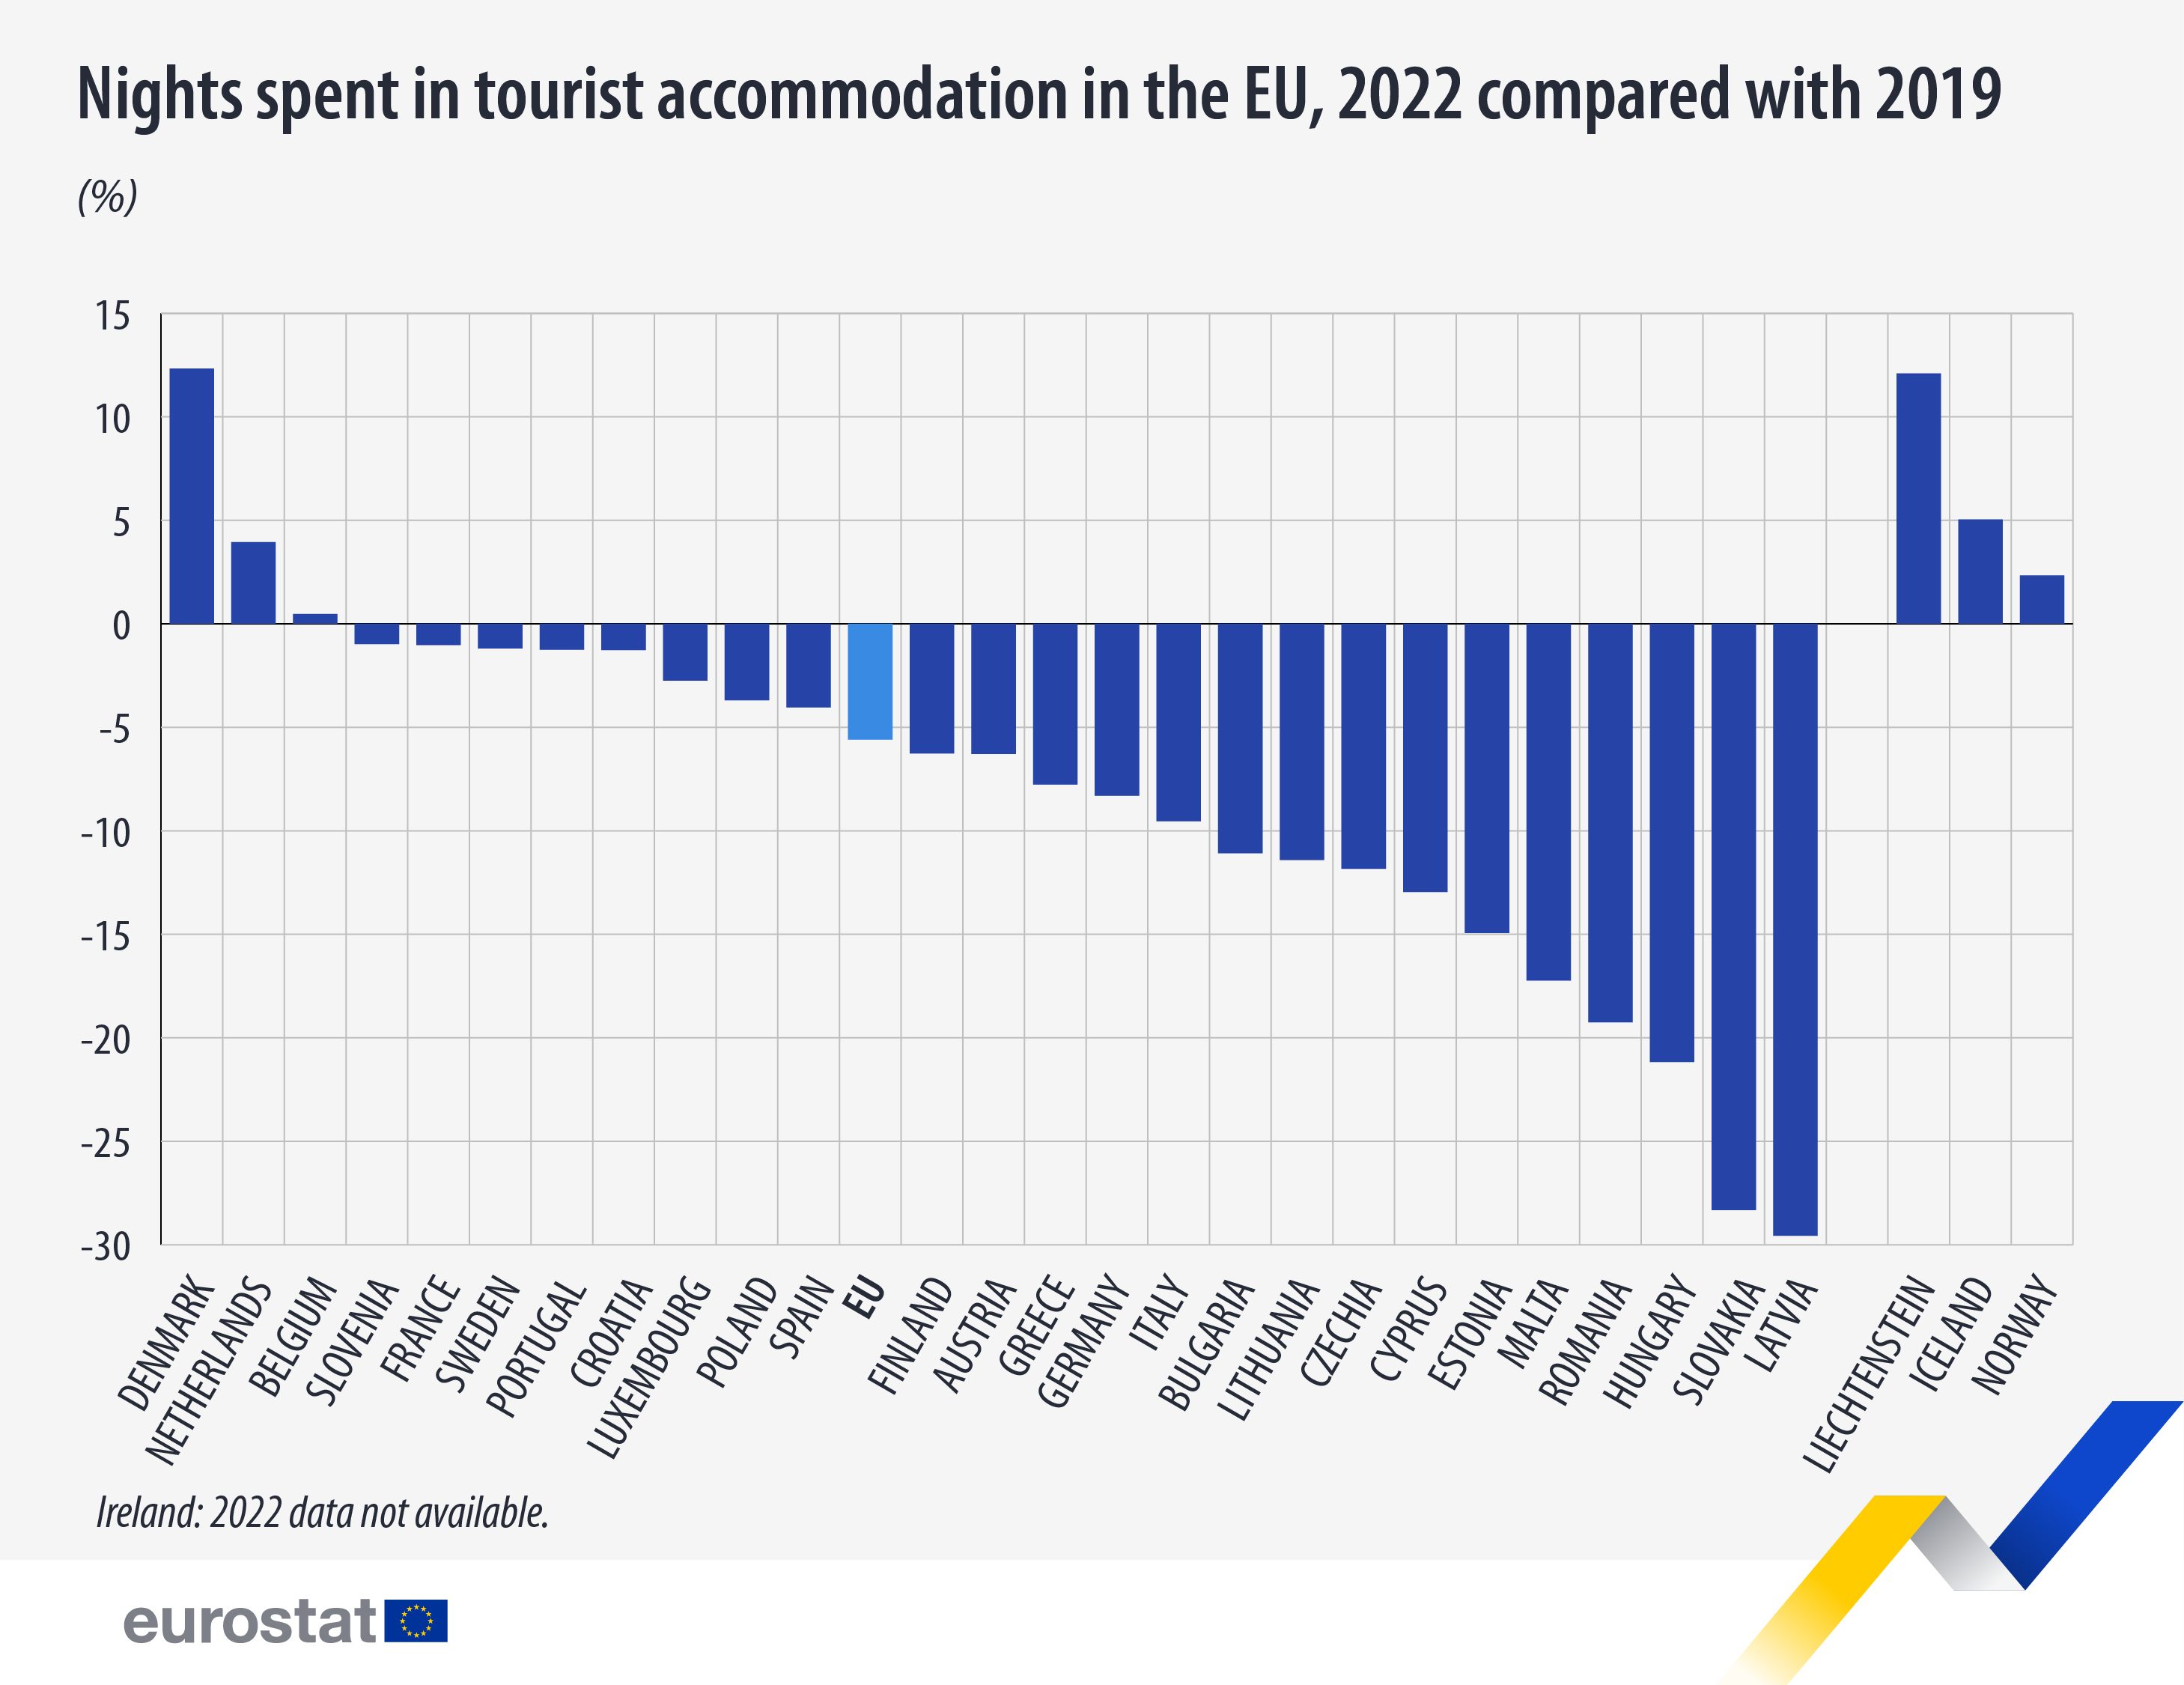
Among the EU countries, the number of nights spent by domestic and foreign tourists in 2022 compared with 2019 increased in three of the Member States with available data: Denmark (38.4 million nights in 2022 compared with 34.3 million in 2019; +12.3%), the Netherlands (128.3 million compared with 123.4 million; +3.9%) and Belgium (42.7 million compared with 42.5 million; +0.5%).
Source datasets: tour_occ_ninat and tour_occ_nim
Meanwhile, other countries have not yet fully recovered from the pandemic’s impact on tourism. This was particularly the case in Latvia (3.9 million in 2022 compared with 5.5 million in 2019; -29.6%) and Slovakia (12.3 million compared with 17.2 million; -28.3%).
For more information
- Statistics Explained article on nights spent at tourist accommodation establishments
- Thematic section on tourism
- Database on tourism
Methodological notes:
- Ireland: 2022 data not available.
- 2022 EU aggregate: estimated using available monthly data.
- The figures in this news article are rounded. As a result, percentage calculations based on these rounded figures may not match the percentage calculations presented in the article, which are calculated on non-rounded figures.
- Nights spent: A night spent (or overnight stay) is each night a guest/tourist (resident or non-resident) actually spends (sleeps or stays) in a tourist accommodation establishment or non-rented accommodation (note that non-rented accommodation is out of the scope of this release).
- Tourism accommodation establishments are classified and described in groups according to the NACE Rev. 2 classification as follows:
- I551 (hotels and similar accommodation)
- I552 (holiday and other short-stay accommodation)
- I553 (camping grounds, recreational vehicle parks and trailer parks)
If you have any queries, please visit our contact us page.


