EU life expectancy at birth 80.6 years in 2022
In 2022, the life expectancy at birth in the EU was 80.6 years, up by 0.5 years from 2021. Over two decades, since 2002, the highest value was recorded in 2019 when life expectancy at birth reached 81.3 years (up 3.7 years compared with 2002). However, after the outbreak of the COVID-19 pandemic, this indicator declined to 80.4 in 2020 and to 80.1 years in 2021. In 2022, life expectancy at birth in the EU rose but did not reach the 2019 value.
This information comes from data on life expectancy published recently by Eurostat. The article presents a selection of findings from the more detailed Statistics Explained article.
Highest life expectancy in Comunidad de Madrid
The EU region with the highest life expectancy at birth was the Spanish region of Comunidad de Madrid (85.2 years), followed by Provincia Autonoma di Trento in Italy (84.4 years), Ile de France in France (84.1 years), Stockholm in Sweden (84.0 years), and Comunidad Foral de Navarra in Spain (83.9 years).
Source dataset: demo_r_mlifexp
On the other hand, among 5 EU regions with the lowest life expectancy at birth, 4 were in Bulgaria: Severozapaden (72.3 years), Severen tsentralen (73.2 years), Yugoiztochen (73.7 years), Severoiztochen (74.1 years); and one in Hungary, Észak-Magyarország (74.1 years).
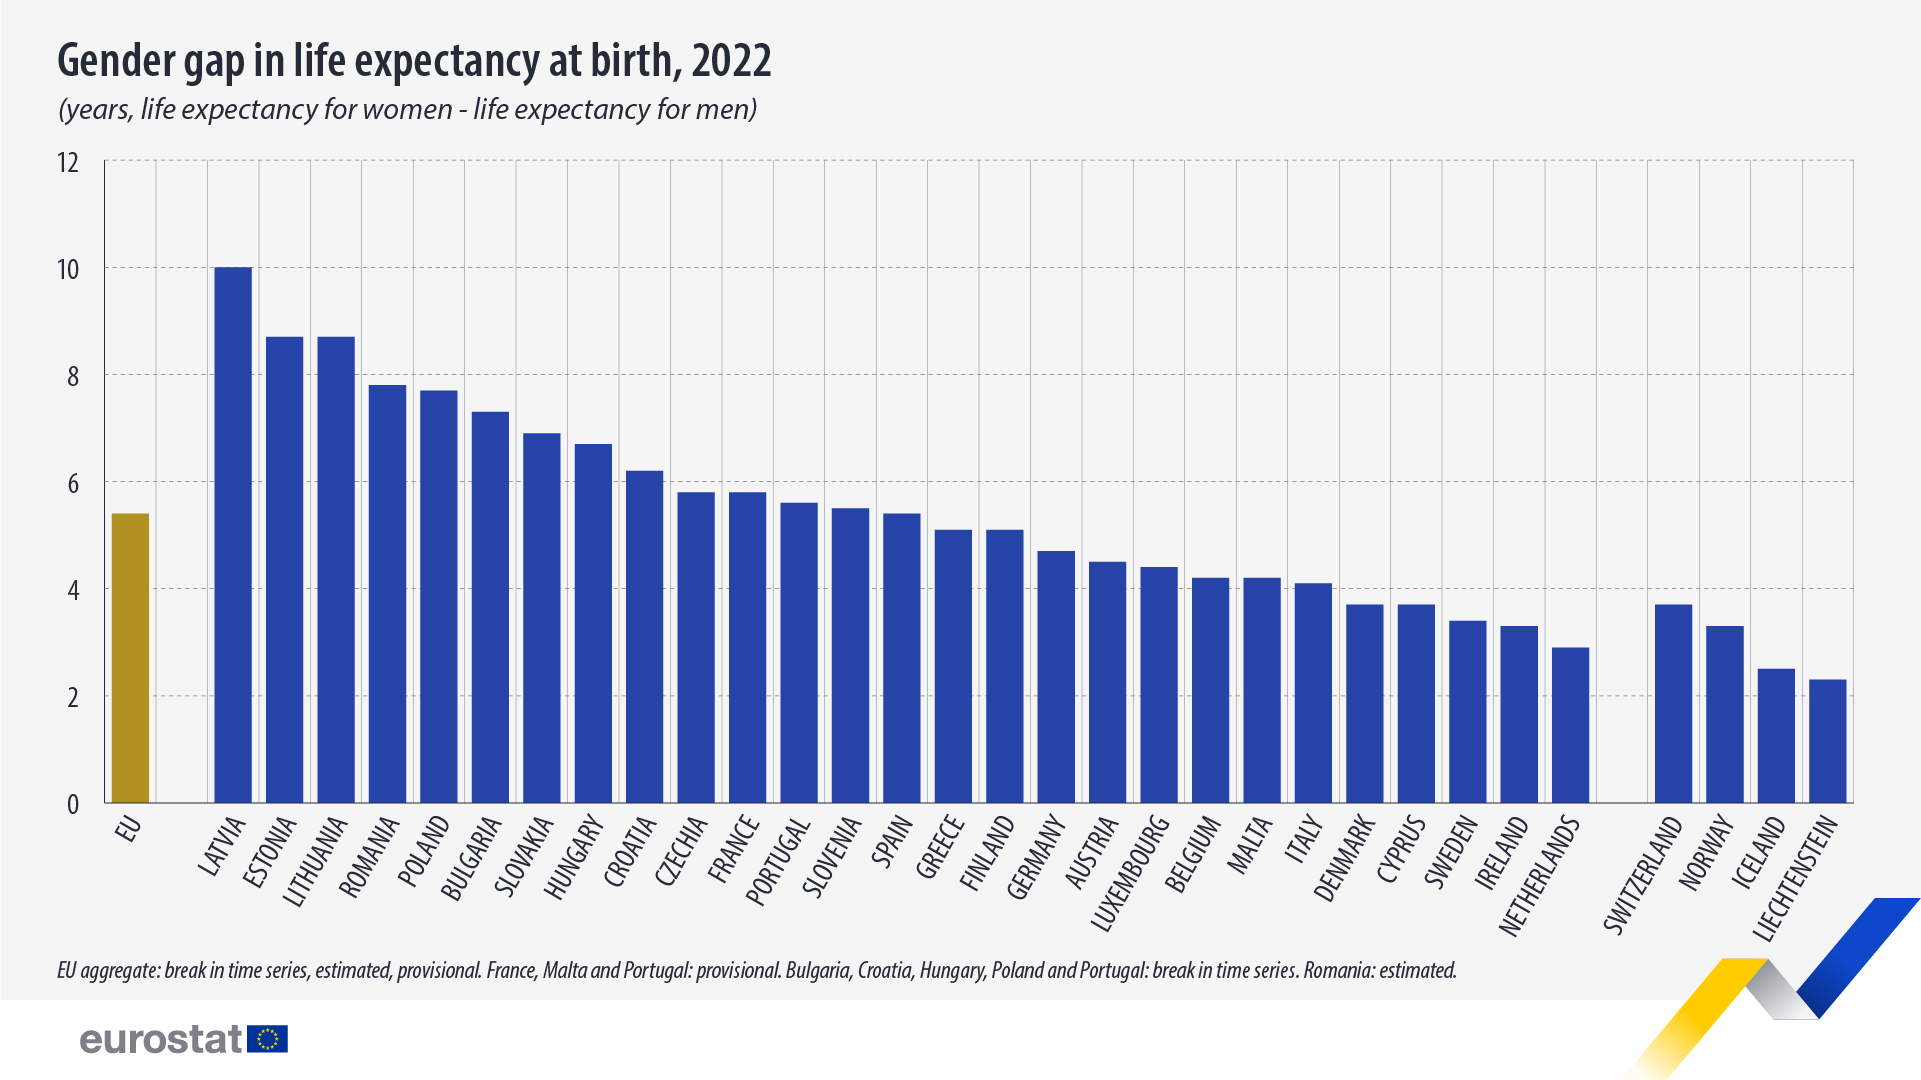
Women expected to live 5.4 years longer
For women in the EU, life expectancy at birth stood at 83.3 years in 2022 (up by 0.4 compared with 2021 but down by -0.7 compared with 2019) and for men at 77.9 years (a 0.7 year increase compared with 2021 but a -0.6 decrease compared with 2019).
In 2022, life expectancy at birth for women in the EU was 5.4 years longer than that for men, with variations between EU countries. In Latvia, women were expected to live 10.0 years longer than men, followed by Estonia and Lithuania (both 8.7 years).
The smallest gender gaps were in the Netherlands (2.9 years), Ireland (3.3 years), and Sweden (3.4 years).

Source dataset: demo_mlexpec
For more information
- Statistics Explained article on mortality and life expectancy statistics
- Dedicated page on population and demography
- Database on demography, population stock and balance
If you have any queries, please visit our contact us page.
