

In 2019, 99% of importing enterprises in total trade (intra-EU and extra-EU) were small and medium-sized enterprises (SMEs), while this share was only slightly lower for exporting enterprises (98%). For both importing and exporting enterprises, this value remained almost unchanged between 2015 and 2019.
Micro enterprises represented the highest share of importing enterprises (77%), significantly higher than small (17%) and medium enterprises (4%).
Source dataset: ext_tec01
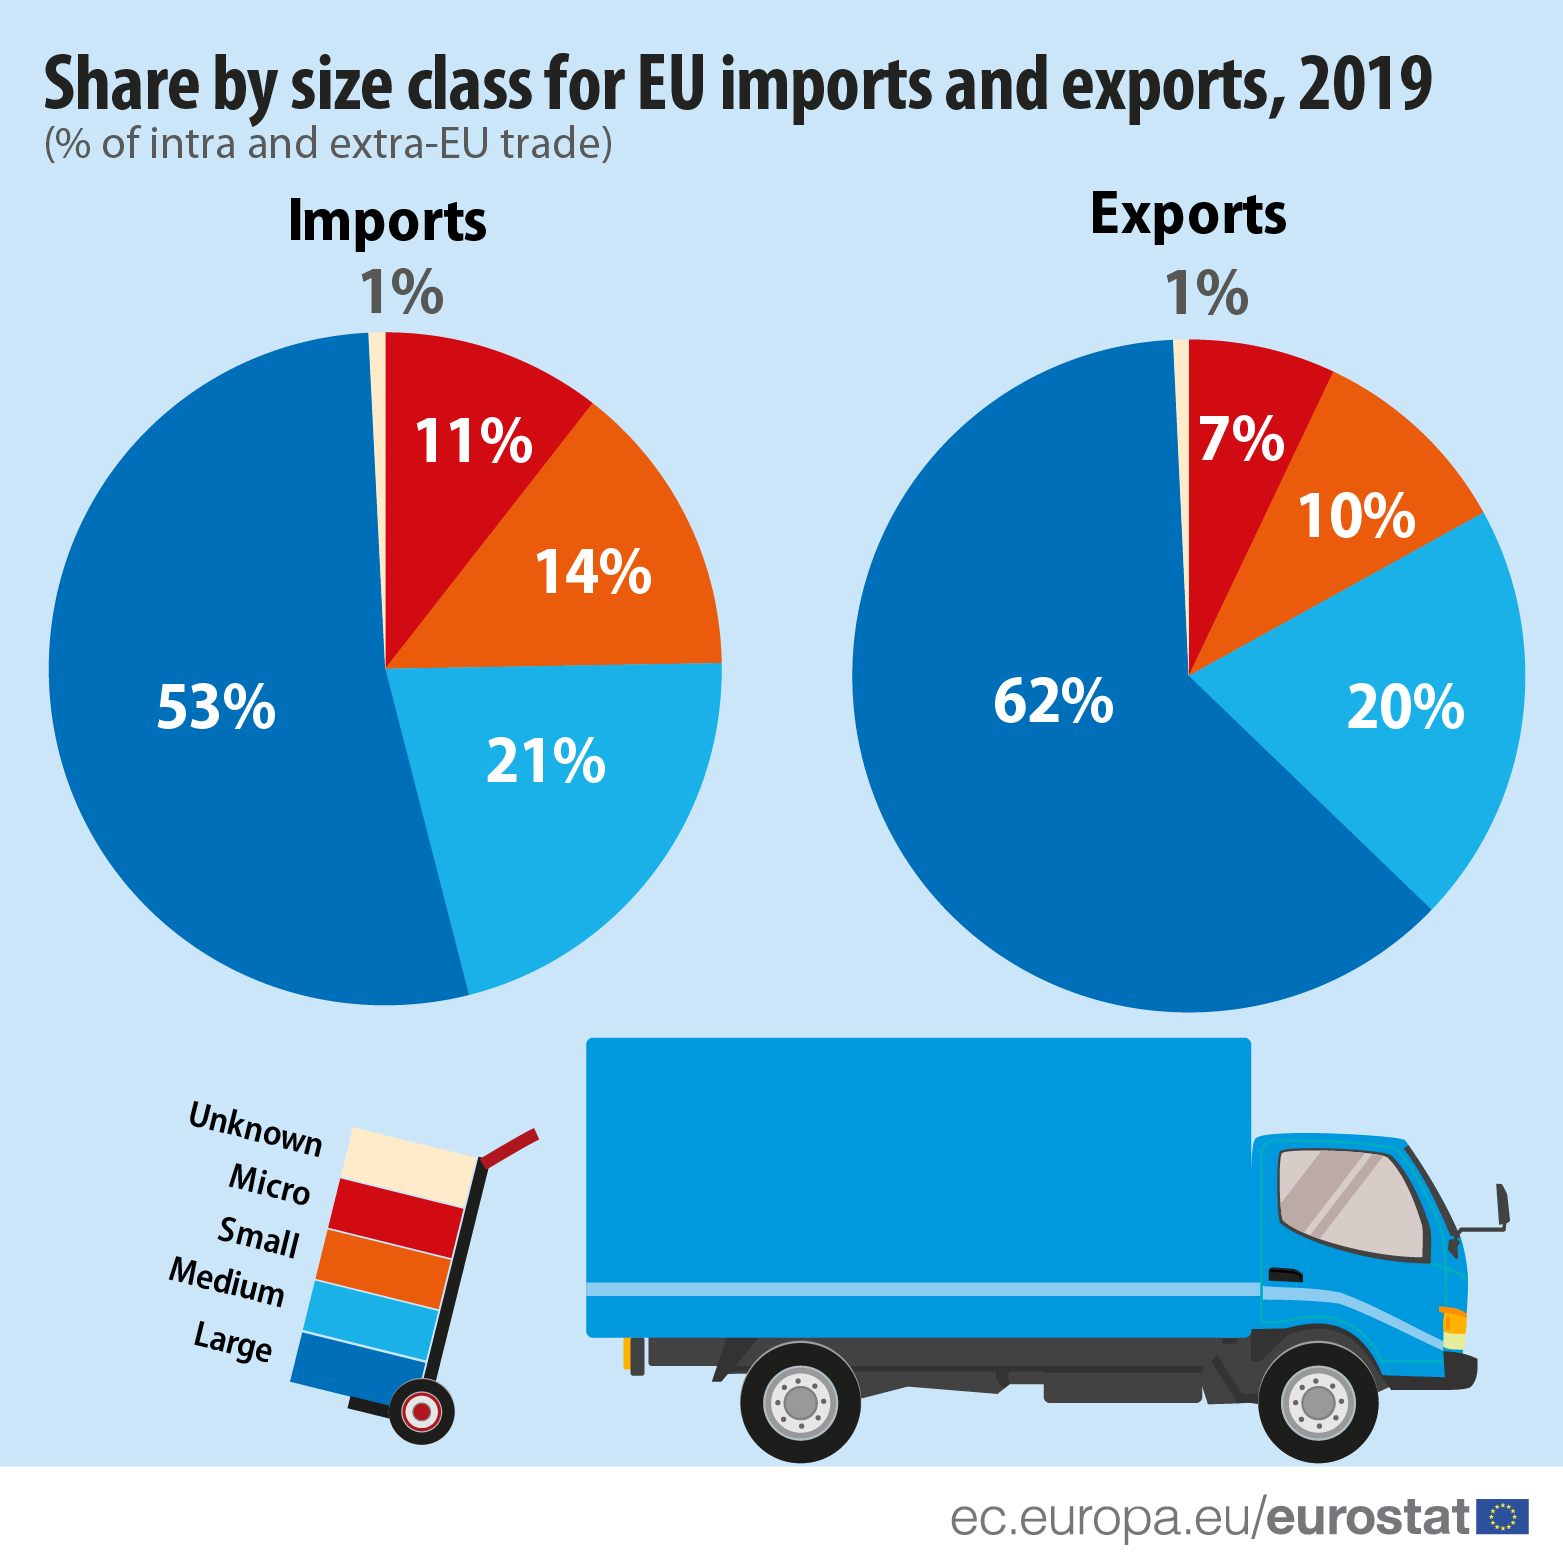
In terms of value of trade, the share of SMEs is smaller than in number of enterprises. SMEs had a share of 46% in EU imports of goods and a share of 37% in exports of goods. For medium (50-249 persons employed) enterprises the shares in imports (21%) and exports (20%) were very close. Micro (0-9 persons employed) enterprises had a slightly higher share in imports than in exports while the reverse was true for small (10-49 persons employed) enterprises.
Source dataset: ext_tec01
Although large importers and exporters (enterprises with more than 250 employees) represented a smaller share of the total number of enterprises in both intra- (1% and 2%) and extra-EU trade (3% and 4%), their weight in terms of value was undisputable.
Large importers and exporters accounted for 51% of the value of imports and 58% of the value of exports in intra-EU trade. In terms of extra-EU trade, they accounted for 58% of the value of imports and 68% of the value of exports, respectively.
For more information:
- Statistics Explained article on International trade in goods by enterprise size
- Database of statistics on international trade in goods
- Overview of statistics on international trade in goods
To contact us, please visit our User Support page.
For press queries, please contact our Media Support.