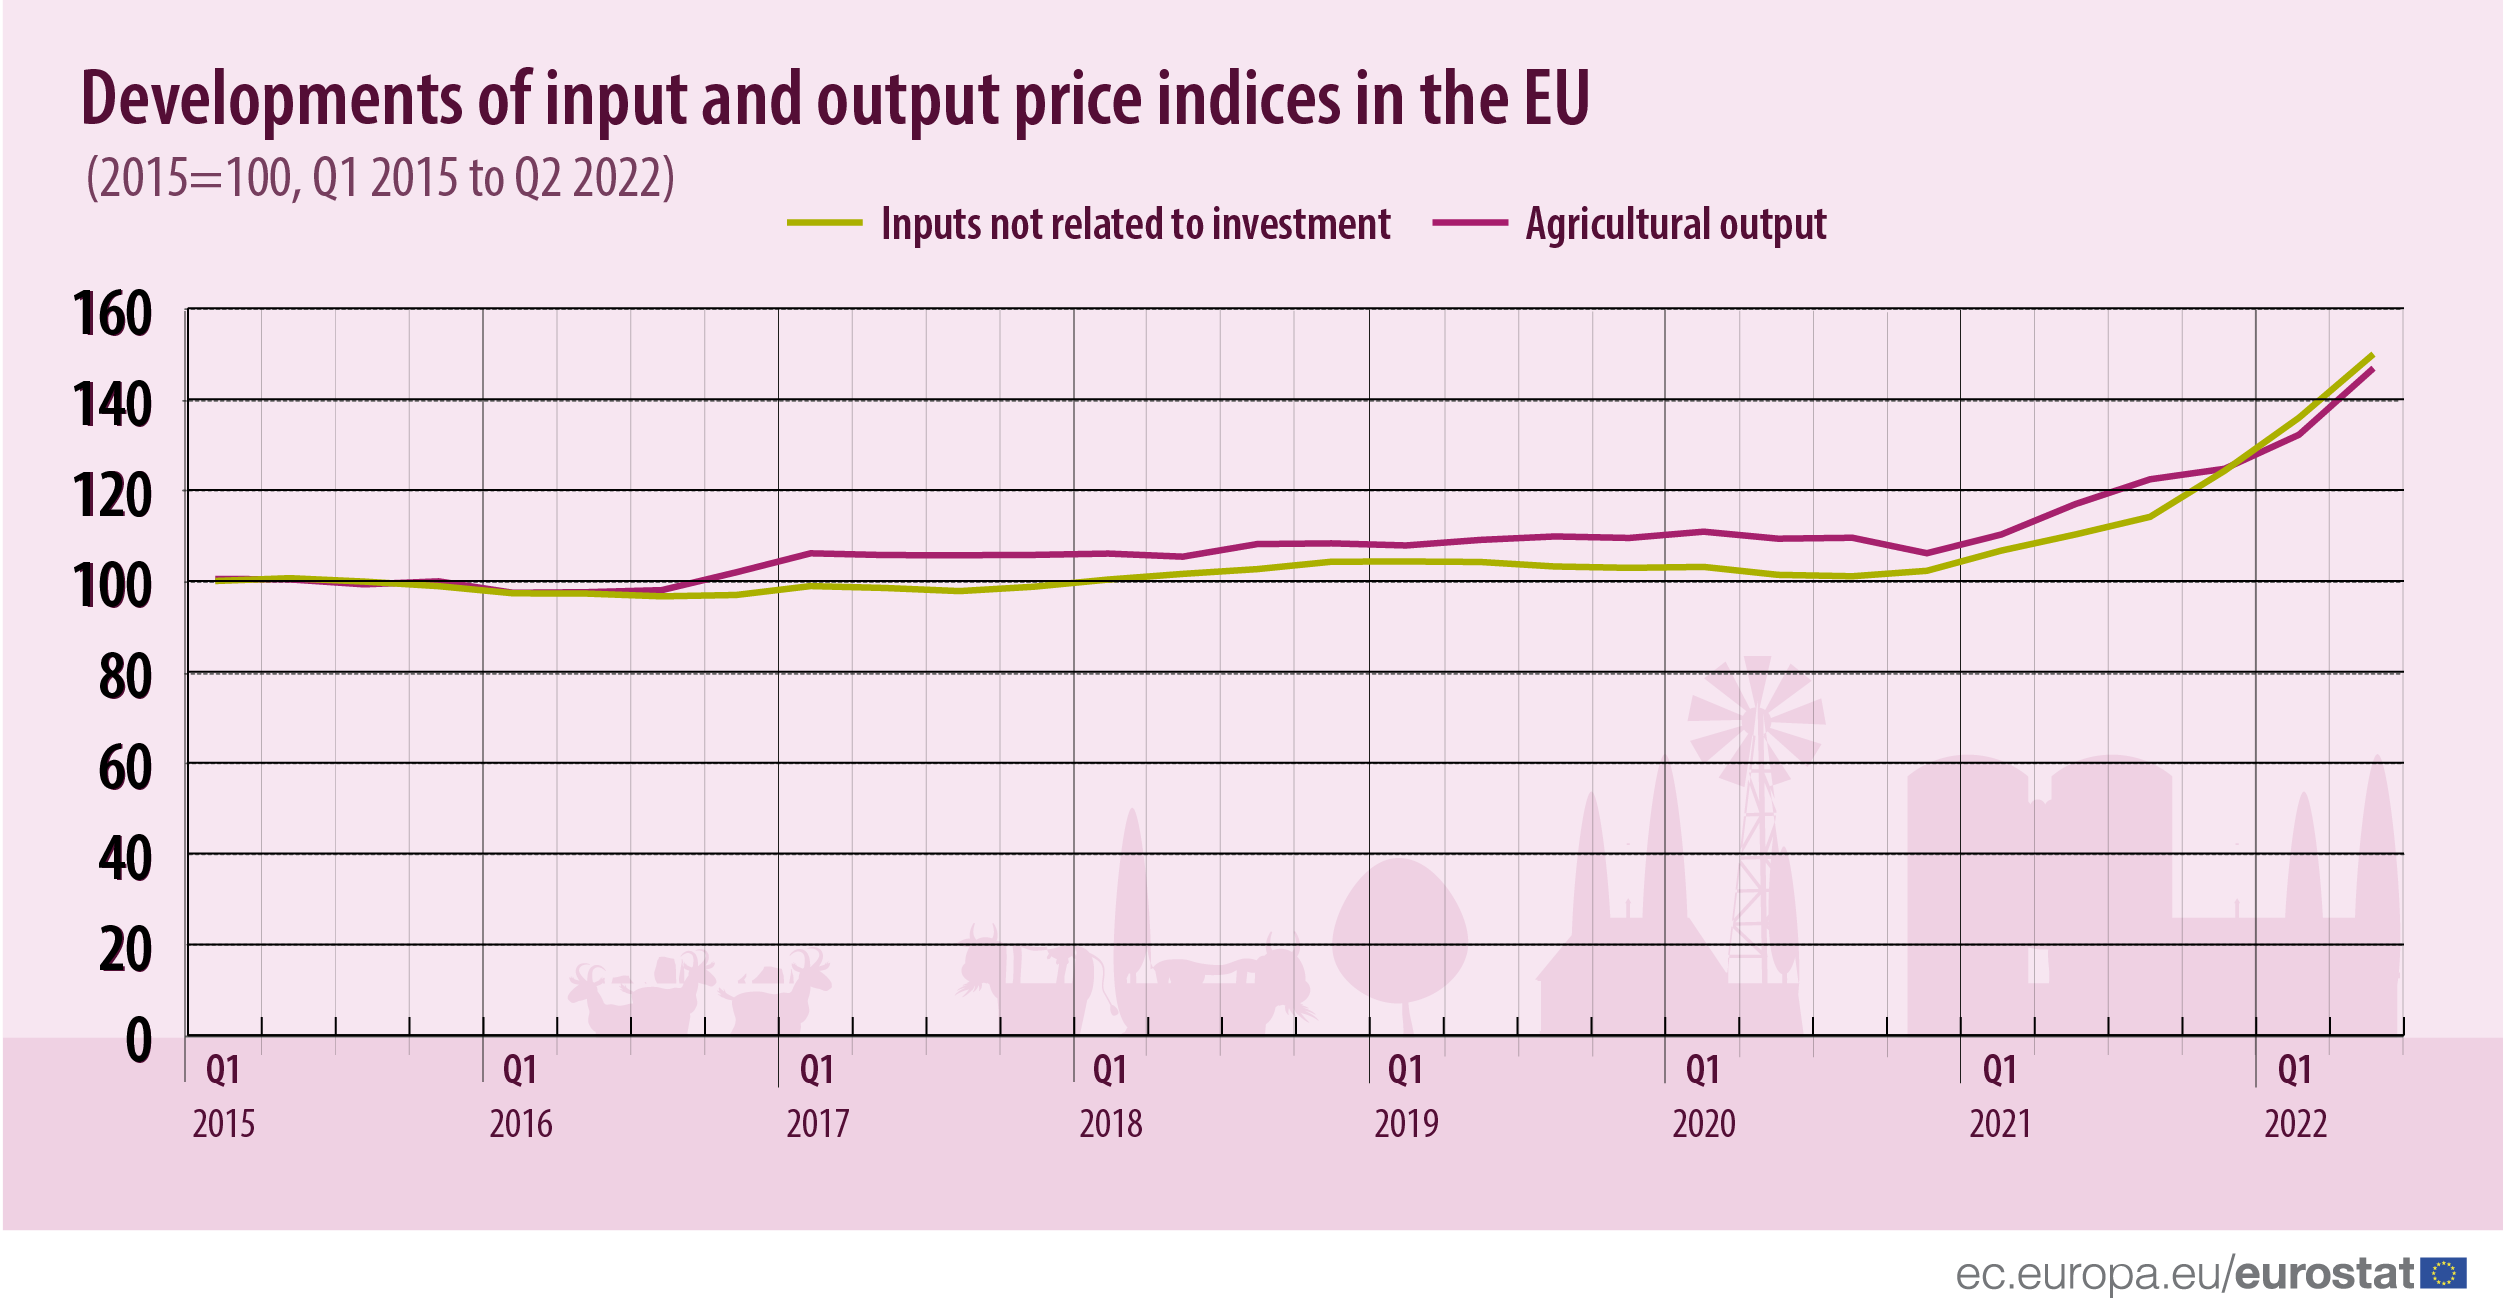
The Russian invasion of Ukraine has significantly disturbed global agricultural markets in 2022. Russia and Ukraine had been major exporters of grains, wheat, maize, oilseeds (particularly sunflowers) and fertilisers until the war started. Furthermore, the actions to phase out the EU’s dependency on Russian fossil fuels have driven up energy prices. This has all underpinned sharp price rises for key agricultural products and inputs, as new Eurostat data shows.
Between the second quarter of 2021 (Q2 2021) and the second quarter of 2022 (Q2 2022), the average price of goods and services currently consumed in agriculture (i.e. inputs not related to investment) jumped by 36% for the same ‘basket’ of inputs. Within this basket, there were considerable price hikes for fertilisers and soil improvers (+116%) and energy and lubricants (+61%).
Over the same period, the average price of agricultural products as a whole (output) also rose sharply (+25%) for the same ‘basket’ of products. There were particularly sharp price increases for cereals (+68%), for oilseeds and oleaginous fruits (+59%) and for eggs (+45%).
This information comes from data on agricultural price indices published by Eurostat today.
Source datasets: apri_pi15_inq and apri_pi15_outq
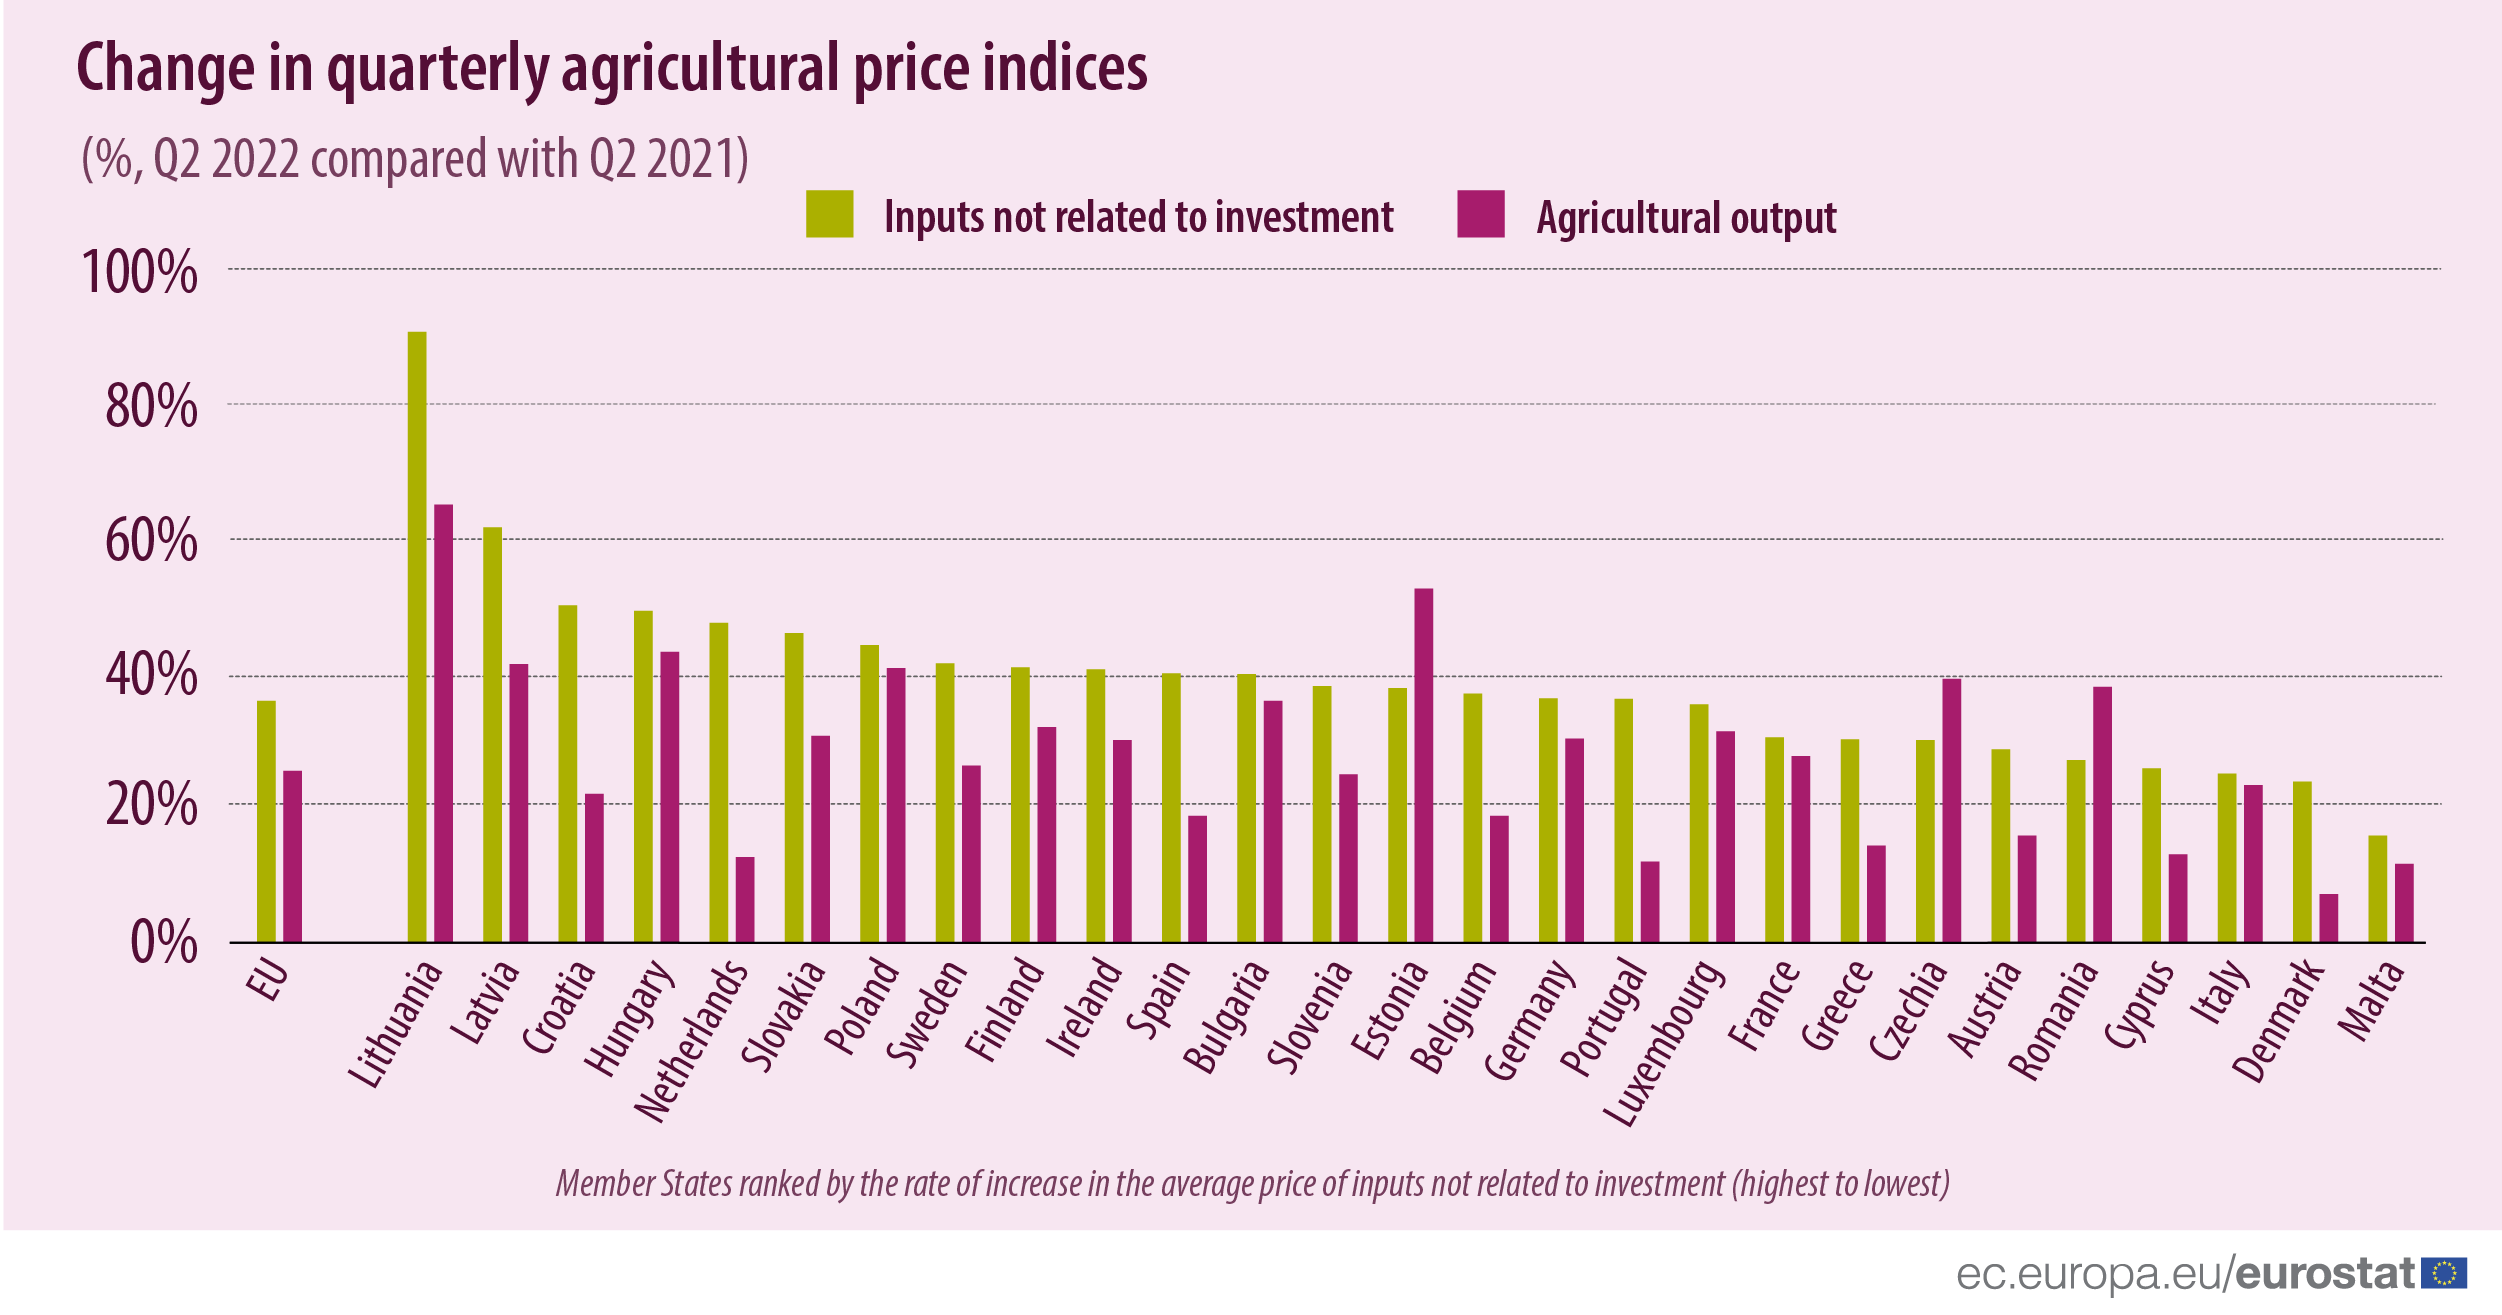
In every Member State, the average price of both inputs not related to investment and agricultural output increased between Q2 2021 and Q2 2022.
The sharpest rates of increase in the average price of agricultural output over this period were observed in Lithuania (+65%), Estonia (+53%) and Hungary (+43%). The smallest rates of increase were observed in Denmark (+7%), Malta and Portugal (both +12%).
The sharpest rates of increase in the average price of inputs not related to investment were recorded in Lithuania (+91%), Latvia (+62%) and Croatia (+50%).
Source datasets: apri_pi15_inq and apri_pi15_outq
For more information:
Methodological notes:
- Oilseeds and oleaginous fruits cover arable crops and fruits that are used for producing oil, such as sunflowers, rape seeds and many nuts.
To contact us, please visit our User Support page.
For press queries, please contact our Media Support.


