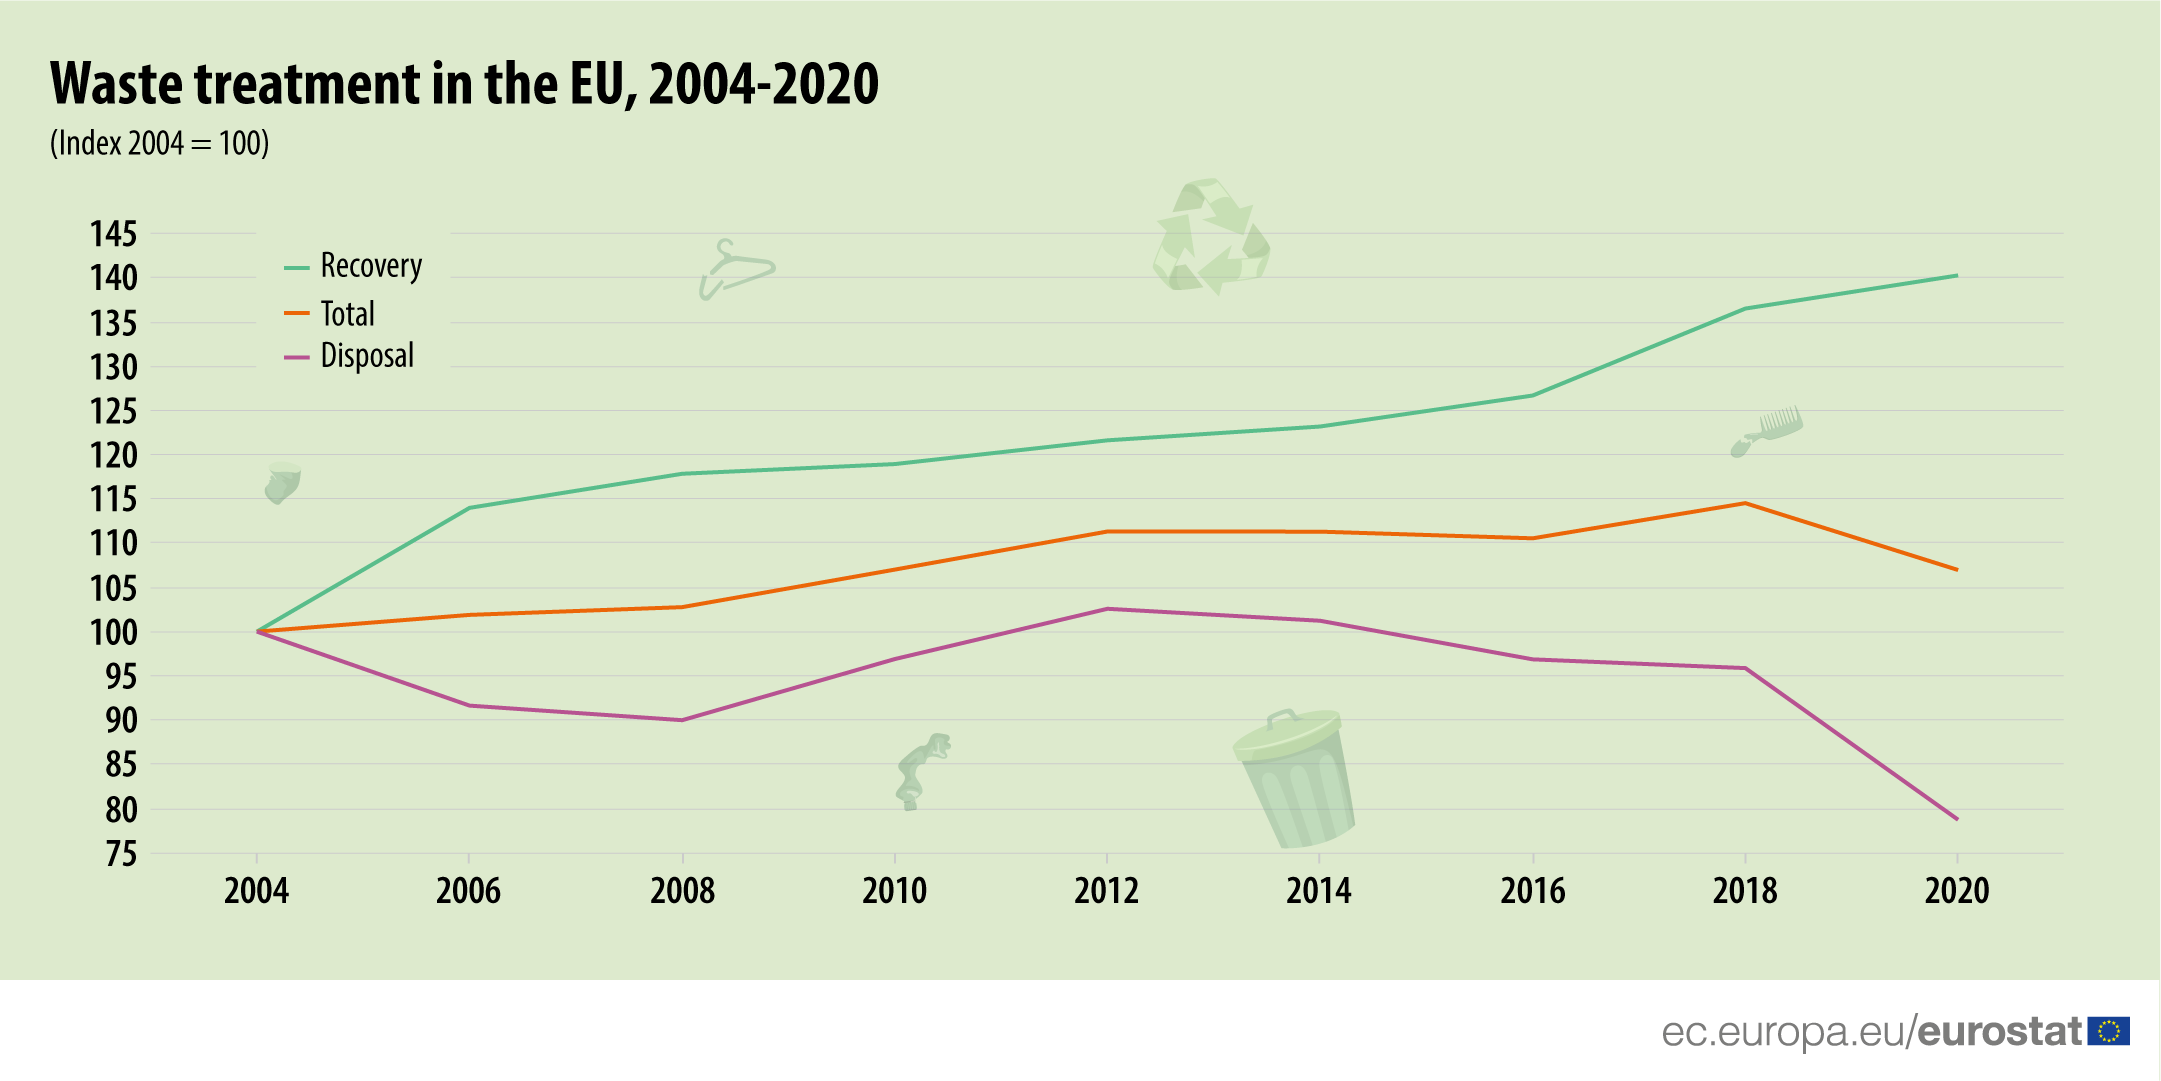
Since 2004, the amount of waste recovered increased significantly (from 870 million tonnes in 2004 to 1 221 million tonnes in 2020). This means that the share of recovery in total waste treatment rose significantly (from 46% in 2004 to 60% in 2020; from 100 to 140 index points).
In contrast, the amount of waste for disposal decreased (from 1 027 million tonnes in 2004 to 808 million tonnes in 2020). This means that the share of disposal in total waste treatment decreased to less than half (from 54% in 2004 to 45% in 2020; from 100 to 79 index points).
This information comes from data on waste published by Eurostat today. The article presents a handful of findings from the more detailed Statistics Explained article.
Source dataset: env_wastrt
The management and disposal of waste can have serious environmental impacts. Therefore, the EU aims to reduce the environmental and health impacts of waste and improve resource efficiency.
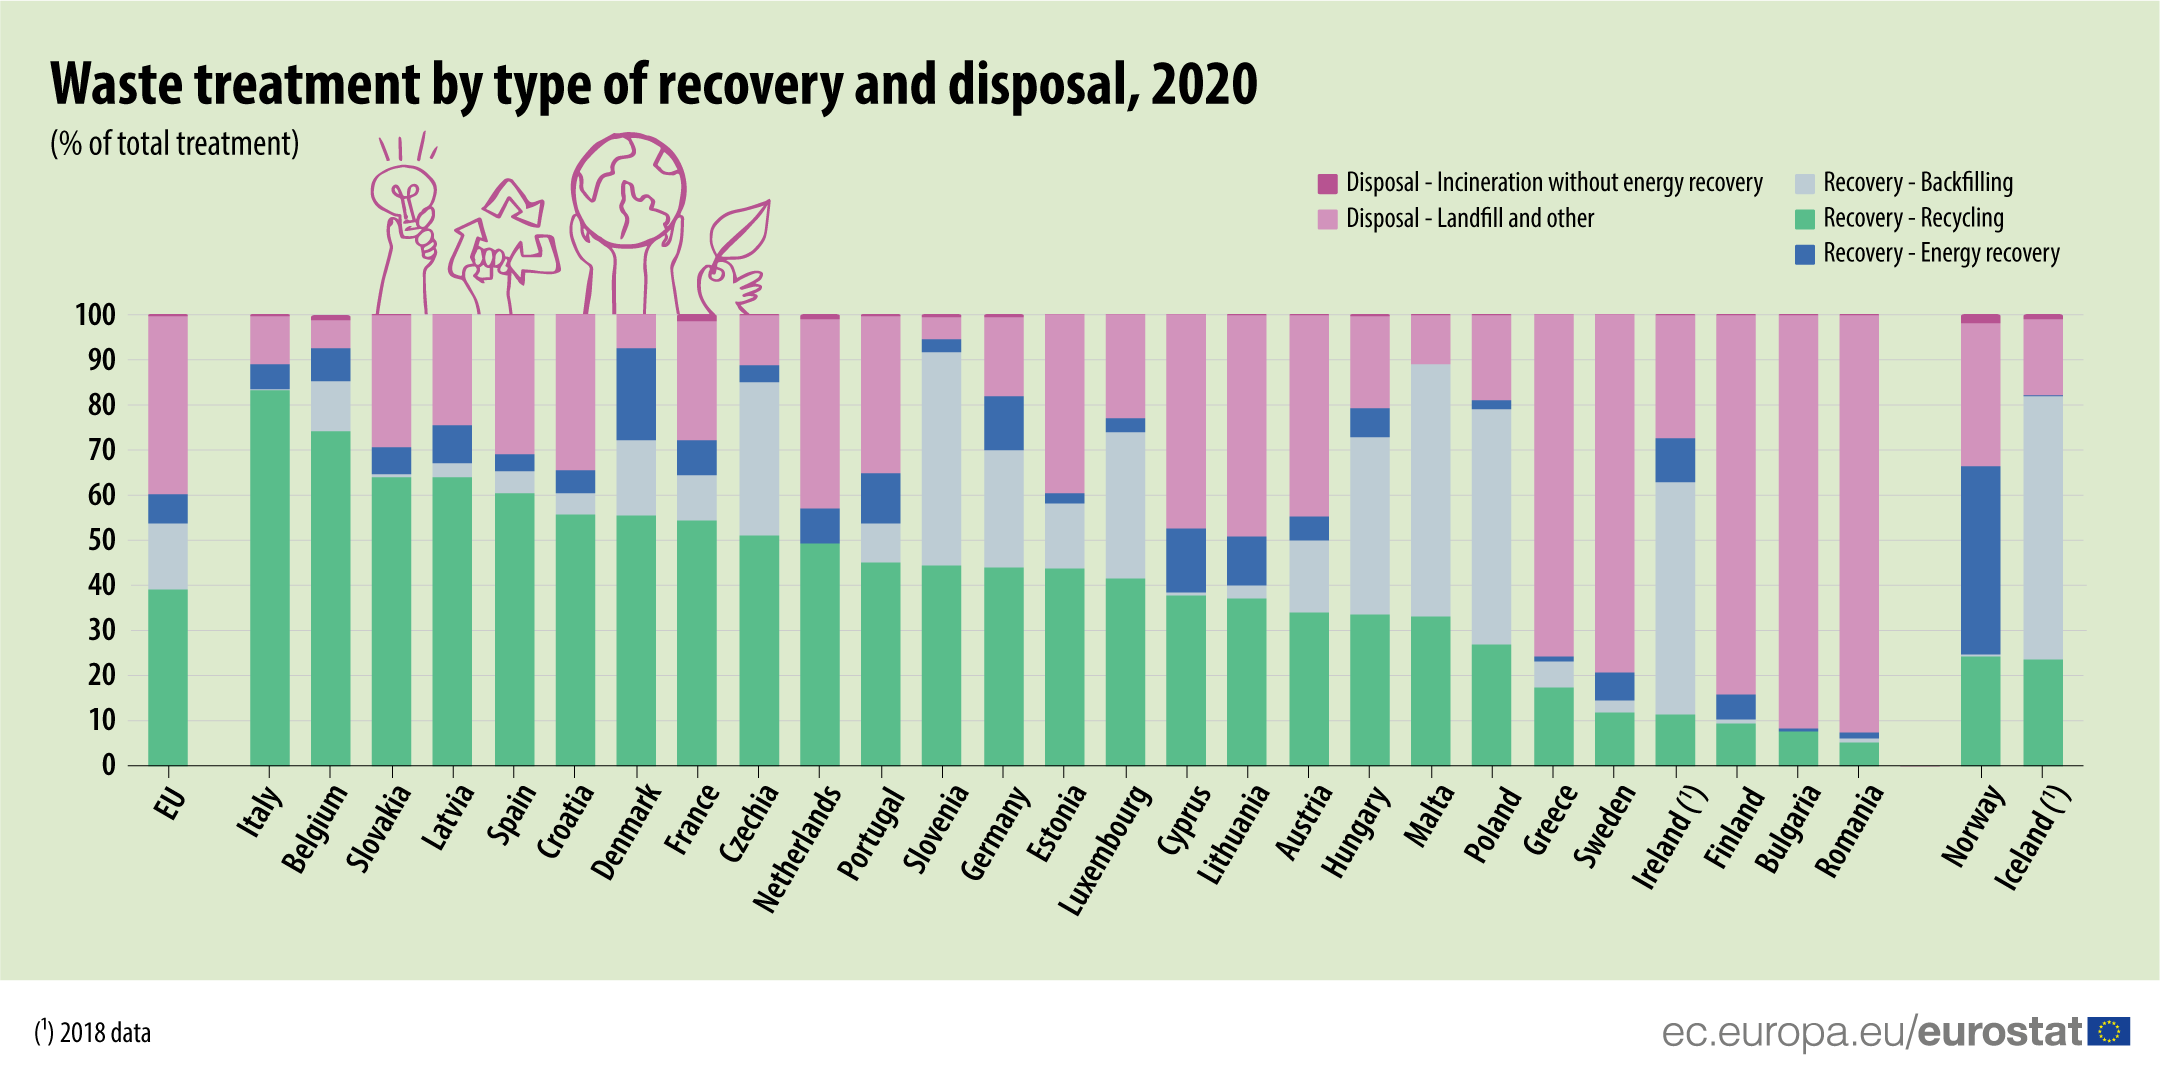
In total, some 2 029 million tonnes of waste were treated in the EU in 2020. More than half (60%) was treated in recovery operations: recycling (39% of total treated waste), backfilling (15%) or energy recovery (6%). The remaining 40% was either landfilled (31%), incinerated without energy recovery (1%) or disposed of otherwise (8%).
Source dataset: env_wastrt
Significant differences could be observed among the EU Member States regarding the use they made of these various treatment methods.
Very high recycling rates were recorded in Italy (83%), Belgium (74%), Slovakia and Latvia (both 64%). On the other hand, disposal via landfill and other was the prevailing treatment category for other countries: Romania (93% landfill, 5% recycling), Bulgaria (92% landfill, 8% recycling) and Finland (84% landfill - 10% recycling).
Would you like to learn more?
Take a look at the interactive graph on generation of waste per capita in the EU, Member States and EFTA countries.
This graph forms part of the Eurostat interactive visualisation tool which shows statistics relevant for the European Green Deal. It presents an overview of 26 indicators divided into 3 main topics: Reducing our climate impact, protecting our planet & health and enabling a green & just transition.
For more information:
- Statistics Explained article on waste statistics
- Podcast episode: “How do we manage waste in the EU”?
- How much waste is treated in the EU?
- What are the main destinations of EU export of waste?
- Dedicated section on waste
- Database on waste
Methodological notes:
- The term "waste" is defined in Directive 2008/98/EC Article 3(1) as "any substance or object which the holder discards or intends or is required to discard".
- Waste treatment does not include exported waste but includes the treatment of waste imported into the EU. The reported amounts are therefore not directly comparable with those on waste generation.
To contact us, please visit our User Support page.
For press queries, please contact our Media Support.


