How to manage bar charts
In the data display panel, click on the tab 'Bar'

Basic functionalities
The following basic actions can be performed when displaying the bar chart:
- mouse over a bar, for example Belgium, and a so-called tooltip with information appears on top
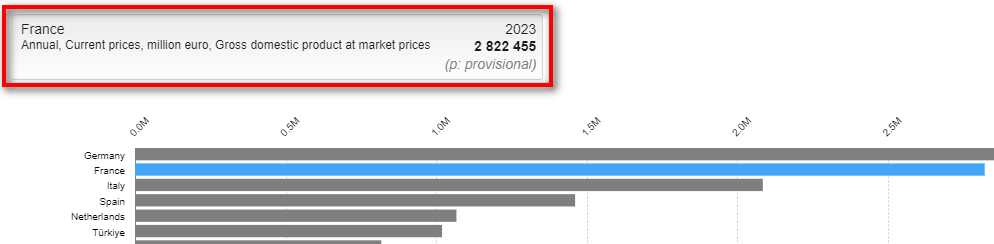
- click on a bar to highlight it and keep it highlighted when moving your mouse over other bars.

Orientation panel
In the case that not all bars are visible and can be displayed, for example because there are too many bars or the screen of your device is small, you can use the right-side navigation side-panel for orientation. This side-panel displays the overview of the data and allows to navigate in the chart

Layout and display of dimensions
You can customise what is shown in the bar chart in the data selection panel:

The X-axis dimension is displayed in form of bars, in the above given example it means that each bar represents 1 country (geopolitical entity).
The series is displayed below the bar chart for you to click and display the related bars, in the above given example this is the years (time).

Highlight option
Click on the button 'Highlight' to refine the display of your chart. This is located on the upper right-hand side of the bar chart.

Clicking on the 'Highlight' button will show a list with the current selection of positions. In that list you can select or deselect positions using the selector field in front. It is also possible to highlight a bar (position) by double-clicking on the name value of the bar. The same action, performed on an already highlighted bar, will remove the highlight.
In case the bar is accessed while there are no highlighted positions, the following rule will apply to ensure a baseline table is rendered:
- in case of a non-GEO (geopolitical entity) dimension, the series having the highest value of the most recent time period is taken. So the bar starts with one series rendered.
- for a GEO dimension and in case aggregates are present in the selection, the most relevant EU and euro area (EA) aggregates are selected. So the bar starts with two series rendered.
- for a GEO dimension and in case no aggregates are present in the selection, again the series having the highest value of the most recent time period is taken, first among the EU countries or then on the full selection. So the bar starts with one series rendered.
Format options
Click on the button 'Format options' to refine the display of your bar chart. This is located on the upper right-hand side of the bar chart.

When you click on this button, a pop-up window will appear with multiple tabs for customisation of the bar chart.

General options
For information on the general options, please consult our page on how to use the format options. Please note - as displayed in the information message in this pop-up window - that the options you select under 'General options' apply to spreadsheets only. For other formats, such as CSV or SDMX, please refine your selection in the advanced settings available via the 'Download' button.
Specific options
For the bar chart, you have 4 tabs with the following specific options

Bar options
Under this tab, you have the following options:
Sorting: by default, bars are sorted descending by data value, meaning from the highest data value to the lowest.
Bar orientation: You can change the orientation of the bars; by default they are horizontal and you can change this to have them displayed vertically.
Bar height: In addition, you can change the height of the bars; by default it is set to tiny, and you can opt to increase their height.
Empty cells
There are 2 options available in this tab:
The first one is 'Show data not available' which is ticked by default. This means that red line is displayed when data is not available.
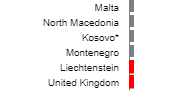
By default, this option is selected. If you do not want to show missing data in the bar chart, please click in the little box to deactivate this setting.
Please note: when this option is deselected and bars are hidden, the following information button will appear on the top left-hand side of the bar chart:

When you click on this text, an information box will appear and show you exactly what has been hidden.
The second option is 'Show "0" values'. This is only activated when there are data with the value 0 in your dataset. Otherwise, this option is greyed out and cannot be clicked. The default view setting is to show these value, meaning the observation is displayed even with a "0" value observation. You can then hide them by deselecting the tick in the box, meaning the observation is not displayed in case of "0" value observation. In this case, a pop-up window will inform you that these have been hidden.
Please note: when this option is deselected and bars are hidden, the following information button will appear on the top left-hand side of the bar chart (see screenshot above). When you click on this text, an information box will appear and show you exactly what has been hidden.
Data displayed
Under the heading 'Show data', you have the following 2 options:
Selected data: the bar chart will only display the data related to the position selected in the page by selector under the bar chart.
Complete with previous: if possible, the bar chart will display the data related to the position selected in the page by selector under the bar chart. If no data is available, previous data will be used.
This selector is not available if there is no 'Time' dimension in the dataset or if the time dimension is displayed in the X-axis dimension in the data selection panel.
Under the heading 'Data displayed', you have the following options:
The highlighted mode allows the bar to display only the positions currently highlighted. The highlighting needs to be done via the 'Highlight' button, located on the right-hand side above the bar chart next to the 'Format options' button.
The summary mode allows the bar chart to display a summary version of the selected data. It is built on the following principles: Among the selected positions, the following positions are the only ones displayed in the chart
- top 10 bars
- 7 average middle bars
- bottom 5 bars
All the other bars are hidden in the chart.
Bars corresponding to positions for which no statistical data is available at all will not be taken into account.
Colour palette
The available options are:
- default: all the bars have a grey background, unless highlighted
- monocolour: the colour of the bars ranges from dark orange to light orange
- contrasted: The colour of the bars uses a high-contrast colour palette
For the monocolour and contrasted choice, multiple additional choice can be taken.
The 'Amount of classes' selector sets the amount of classes to be used, with a minimum of 2 and a maximum of 12.
The classification method selector sets the bar classification for the bar chart:
- quantile: each interval contains the same amount of observations
- equal intervals: each interval has the same size, with 'size' defined as the difference between the upper limit and the lower limit of each interval
- custom intervals: each interval’s size limits can be customised by dragging the cursor to the desired value. Alternatively, you can set the new limits in the popup which is displayed when clicking on one of the limit points:

Export, embed, and print
These functionalities are located on the top right-hand side of the bar chart

Export chart
When clicking on 'Export chart', a pop-up will appear

In the drop-down field, different file formats are available for the export:
- image in png format (png stands for 'Portable Network Graphics')
- PDF document (PDF stands for 'Portable Document Format')
- svg vector image (SVG stands for 'Scalable Vector Graphics')
In addition, you need to decide on the chart elements to display:
- title: meaning the title of the dataset you are using
- dimensions and positions summary: meaning the selection you have done in the data selection panel, for example the year and unit of measurement, which will be displayed a subtitle
- context: meaning information on the source, dataset title and code, last update date of dataset, disclaimer.
All 3 options are ticked by default. Once you have made your selections, please click on 'Generate file' and check your downloads.
Limitations
It is not possible to export a bar chart which contains:
- more bars than what the screen is able to display simultaneously
- more than 60 bars (horizontal or vertical).
In such situations, the export button will be disabled and cannot be used.
Embed chart
When clicking on 'Embed chart', a pop-up will appear
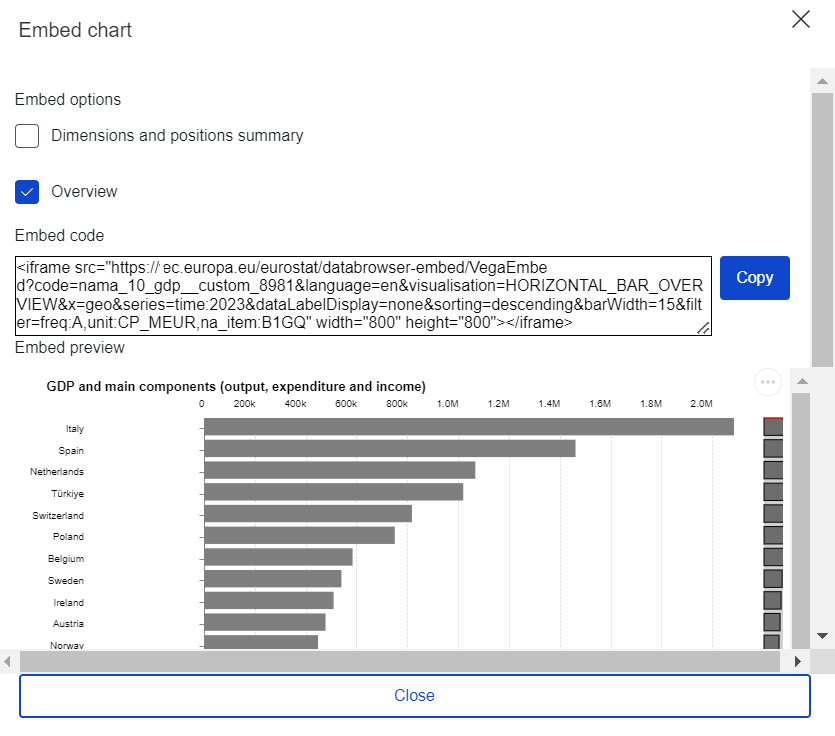
Click on the button 'Copy' located on the right-hand side of the embed code. This will automatically select all the code and copy it into the clipboard. A success message will also appear to inform you about this. If this message does not appear, it means the code has not been copied. In this case, you can also manually select the embed code with your mouse and use the copy and paste functionality of your keyboard.

Print chart
You can also choose to print the bar chart using the built-in print functionality of your browser. This can normally be accessed with the keyboard combination CRTL+P, meaning to press simultaneously the control button and the letter P. Alternatively, you can also open the browser settings and select 'Print' in the list.
If available in your browser's print dialog box, make sure to adjust the print settings in a way that the full bar chart will be displayed, for example the orientation and scale.