PPPs for GDP per capita in 2024: preliminary estimates

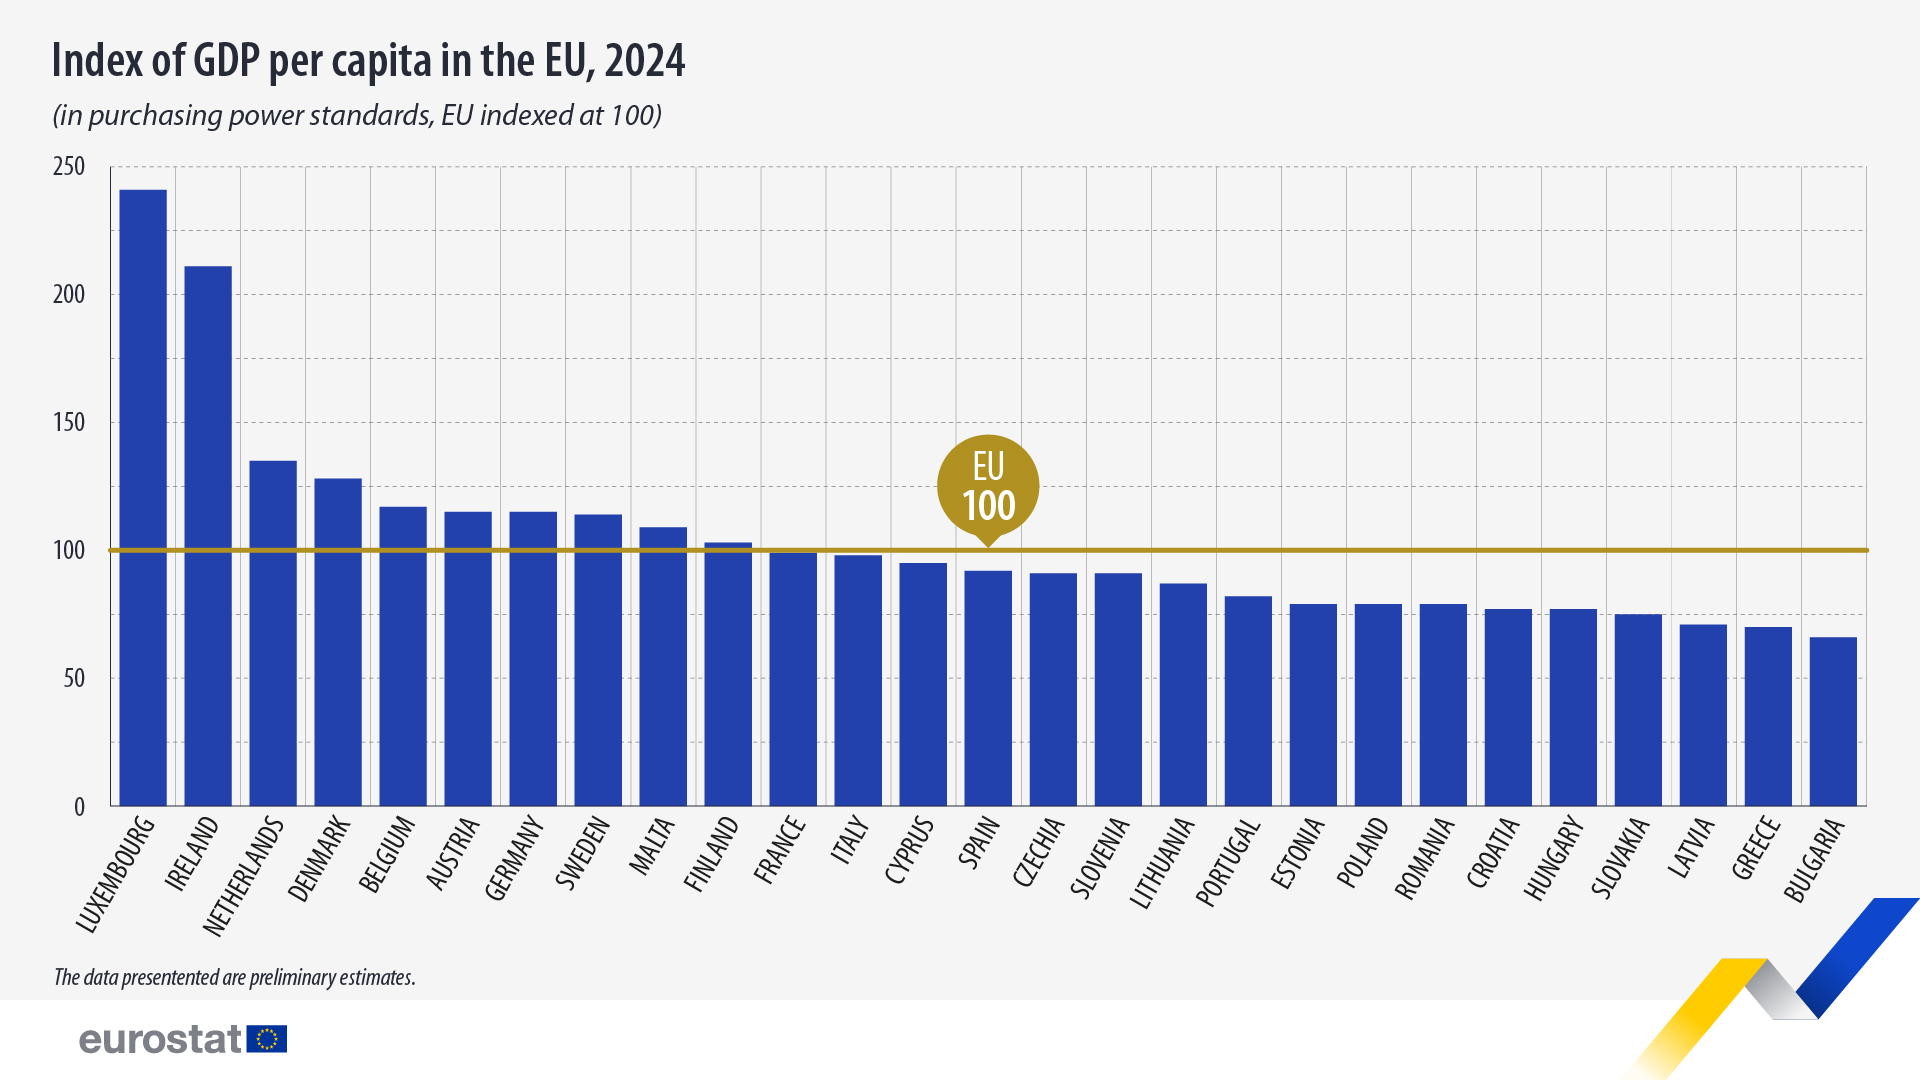
In 2024, the gross domestic product (GDP) per capita expressed in purchasing power standards (PPS) ranged between 66% of the EU average in Bulgaria and 241% in Luxembourg.
This information comes from the preliminary estimates of purchasing power parities (PPPs) and GDP for 2024 published by Eurostat. The article presents some of the findings from the more detailed Statistics Explained article.
Source dataset: prc_ppp_ind
In 2024, substantial differences in GDP per capita expressed in purchasing power standards were observed among EU countries. 10 countries, representing about 34% of the EU’s population, exceeded the EU average in GDP per capita.
Luxembourg and Ireland had the highest levels (141% and 111% above the EU average, respectively), well ahead of the Netherlands (35% above the EU average), Denmark (+28%) and Belgium (+17%).
The lowest level of GDP per capita was registered in Bulgaria, at 34% below the EU average. Greece and Latvia also fell below the average, by 30% and 29%, respectively.
For more information
- Statistics Explained article on purchasing power parities and GDP per capita -preliminary estimate
- Thematic section on purchasing power parities
- Database on purchasing power parities
- Metadata on purchasing power parities
- Statistics 4 beginners on GDP
Methodological notes
- PPPs, are indicators of price level differences across countries. PPPs tell us how many currency units a given quantity of goods and services costs in different countries. Using PPPs to convert expenditure expressed in national currencies into an artificial common currency, the purchasing power standard (PPS), eliminates the effect of price level differences across countries created by fluctuations in currency exchange rates.
- The GDP per capita figures in this article are compared to the European Union average and measured in PPS for more accurate comparison.
- Preliminary estimates for 2024 presented in this news article are based on GDP and population data for 2024, extracted on 19/03/2025 and the most recent PPPs available. GDP and population data for Luxembourg were published on 26/03/2025. Revised estimates will be published in June 2025.
- Luxembourg: the high GDP per capita in Luxembourg is partly due to the country’s large share of cross-border workers in total employment. While contributing to the GDP, these workers are not taken into consideration as part of the resident population which is used to calculate GDP per capita.
- Ireland: the high level of GDP per capita in Ireland can be partly explained by the presence of large multinational companies holding intellectual property. The associated contract manufacturing with these assets contributes to the GDP, while a large part of the income earned from this production is returned to the companies’ ultimate owners abroad.
If you have any queries, please visit our contact us page.