Volatility in transport fuel and lubricant prices

Since 2020, fuel and lubricant prices for personal transport in the EU have shown significant volatility. Annual inflation rates were negative in May 2020 (-19.5%) but started to increase steeply in 2021, reaching +33.4% in November that year. The peak arrived in June 2022 (+39.2%) and after that, it started to slow down, turning negative in 2023. These variations reflected the impact of the COVID-19 pandemic and the Russian invasion of Ukraine.
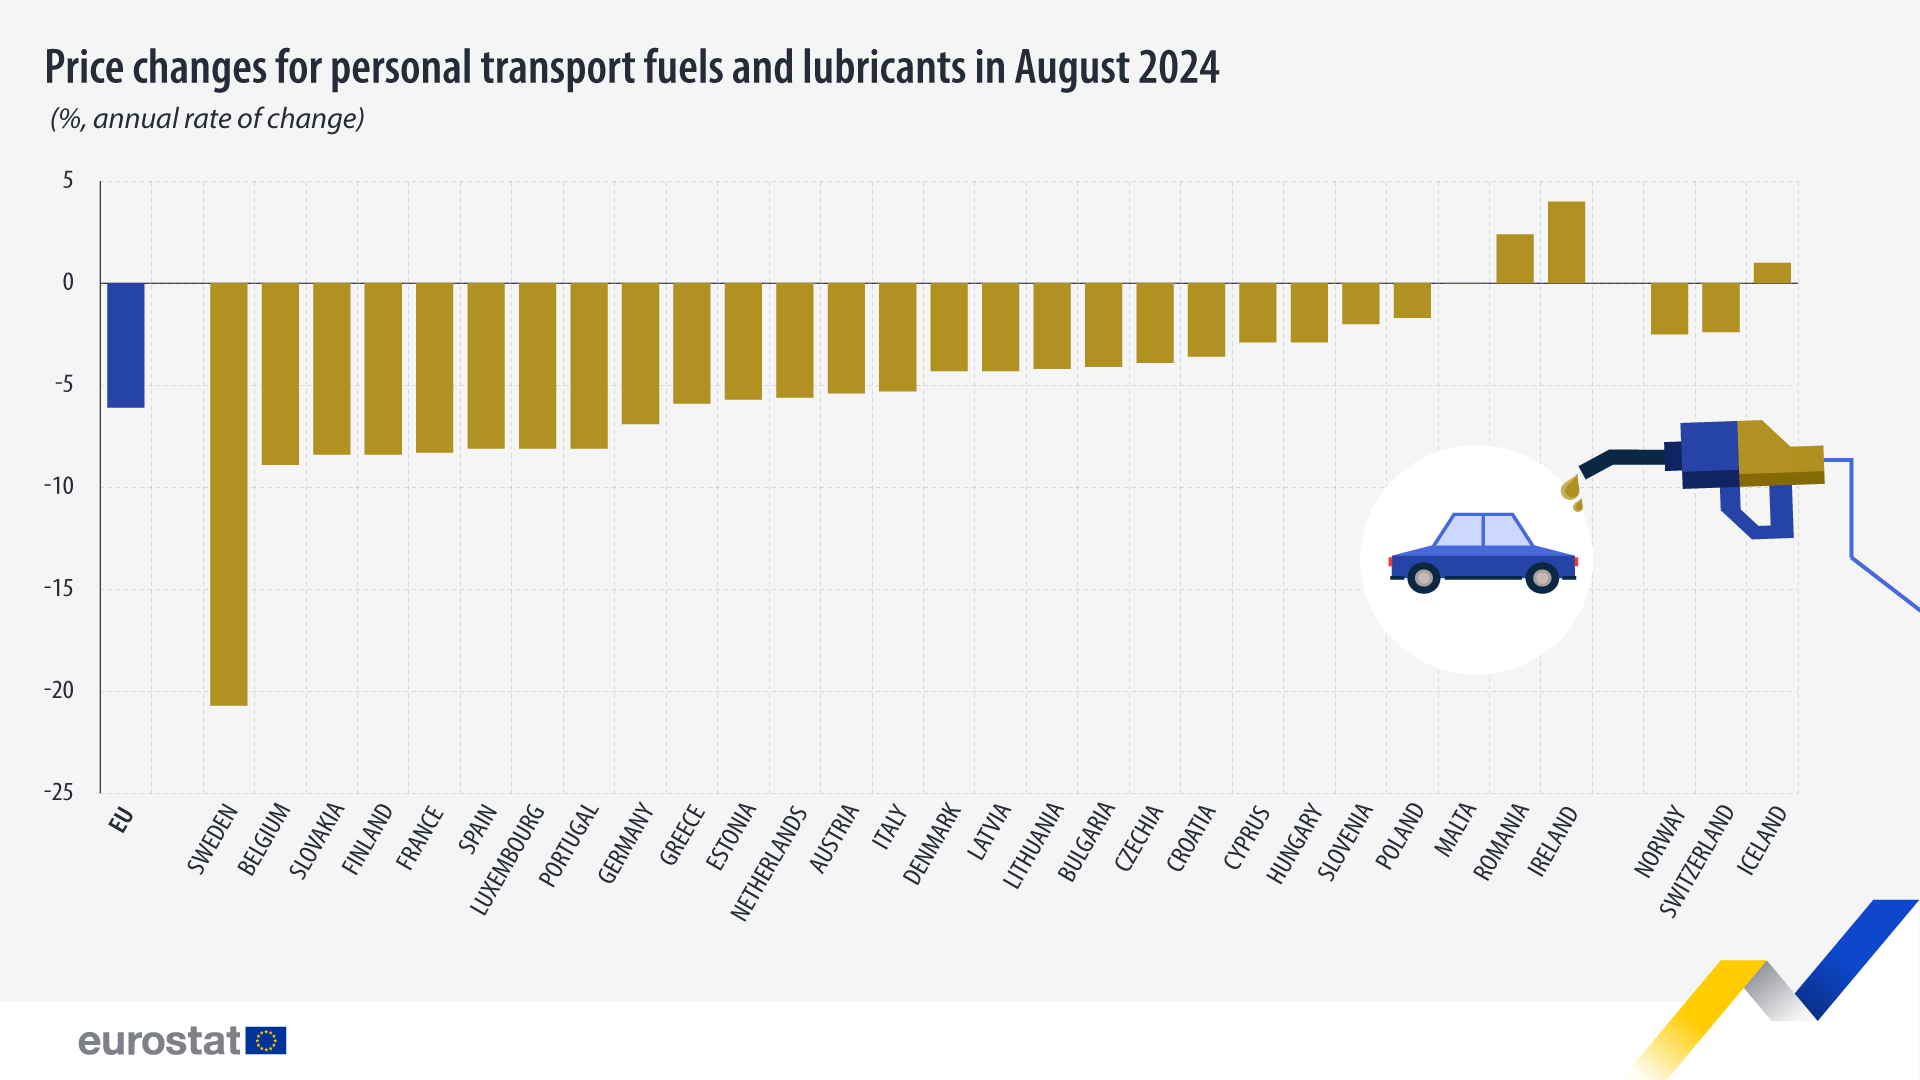
In June 2023, the inflation rate for fuel and lubricants was at a low of -15.7%, but volatility has become less pronounced in recent months with smaller monthly price variations. This has been the case in 2024. In August 2024, prices of fuel and lubricant were 6.1% lower than in August 2023.
Source dataset: prc_hicp_manr
Looking specifically at diesel and petrol since 2020, data shows that prices last August were 7.4% and 5.5% lower than in the same month last year, respectively. Since 2020, the highest increase in prices were observed in June 2022, +45.2% for diesel and +35.7% for petrol. While the price increases of diesel were generally lower than those of petrol, diesel prices went up faster than petrol prices from September 2021 to March 2023. From this month onwards, diesel prices increases remained below those of petrol, however the situation reversed again in June, July and August this year.
Most EU countries report negative inflation rates for fuels and lubricants
In August 2024, 24 EU countries reported negative annual rates of change or lower prices than the same month last year. Sweden (-20.7%) reported the highest drop, followed by Belgium (-8.9%) and Slovakia (-8.4%). Meanwhile, Slovenia (-2.0%) and Poland (-1.7%) registered the smallest decreases. Prices in Malta remained without change, and Romania (+2.4%) and Ireland (+4.0%) experienced an increase in the annual rate of change.
Source dataset: prc_hicp_manr
For more information
- Thematic section on harmonised indices of consumer prices (HICP)
- Database on harmonised indices of consumer prices (HICP)
Methodological notes
- This information was obtained from the harmonised index of consumer prices (HICP), which is mainly used to measure inflation.
- Prices in Malta have been regulated since 2020.
- The ECOICOP code used for this article is:
If you have any queries, please visit our contact us page.


