EU trade in goods records a growing surplus

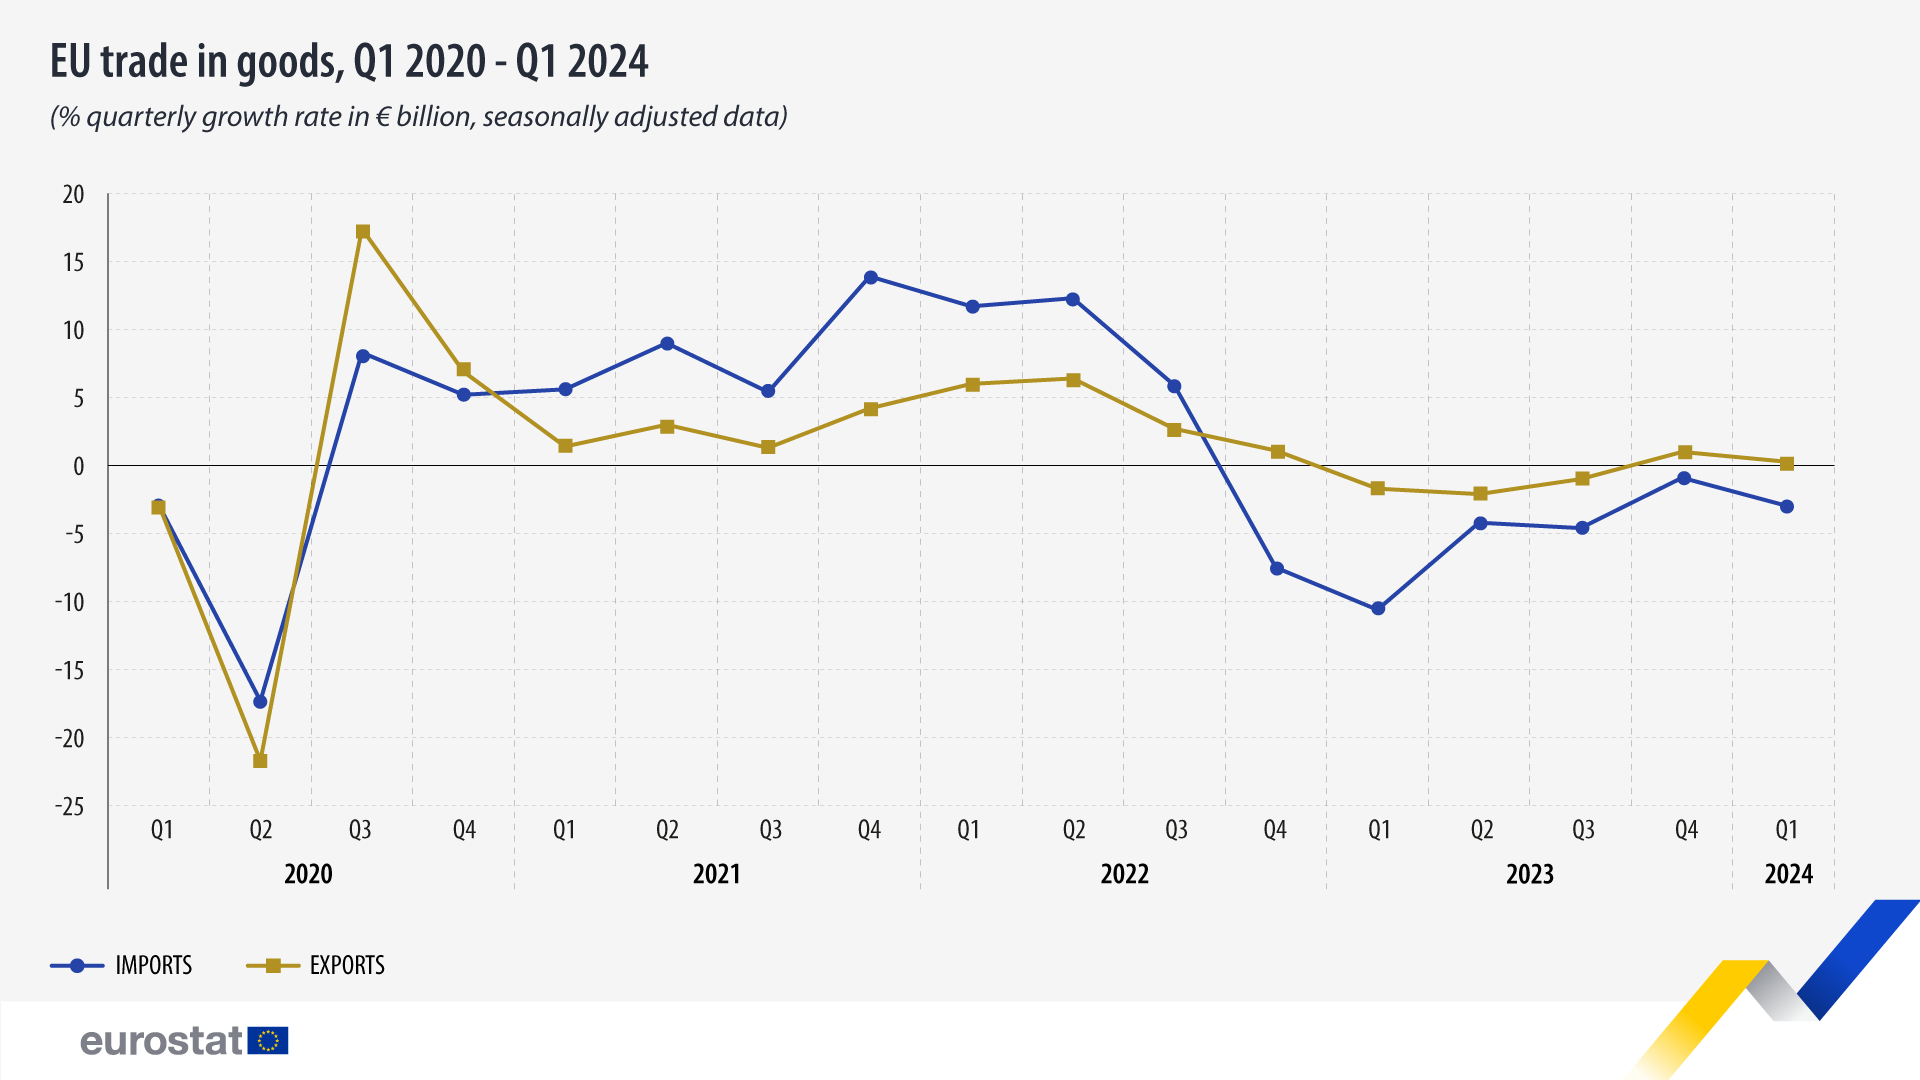
In the first quarter of 2024, imports of goods from non-EU countries to the EU decreased by 2.9% compared with the previous quarter, while exports increased by 0.3%. This marks the second consecutive quarter of rising export levels, whereas imports have been declining for 6 consecutive quarters.

Source dataset: ext_st_eu27_2020sitc
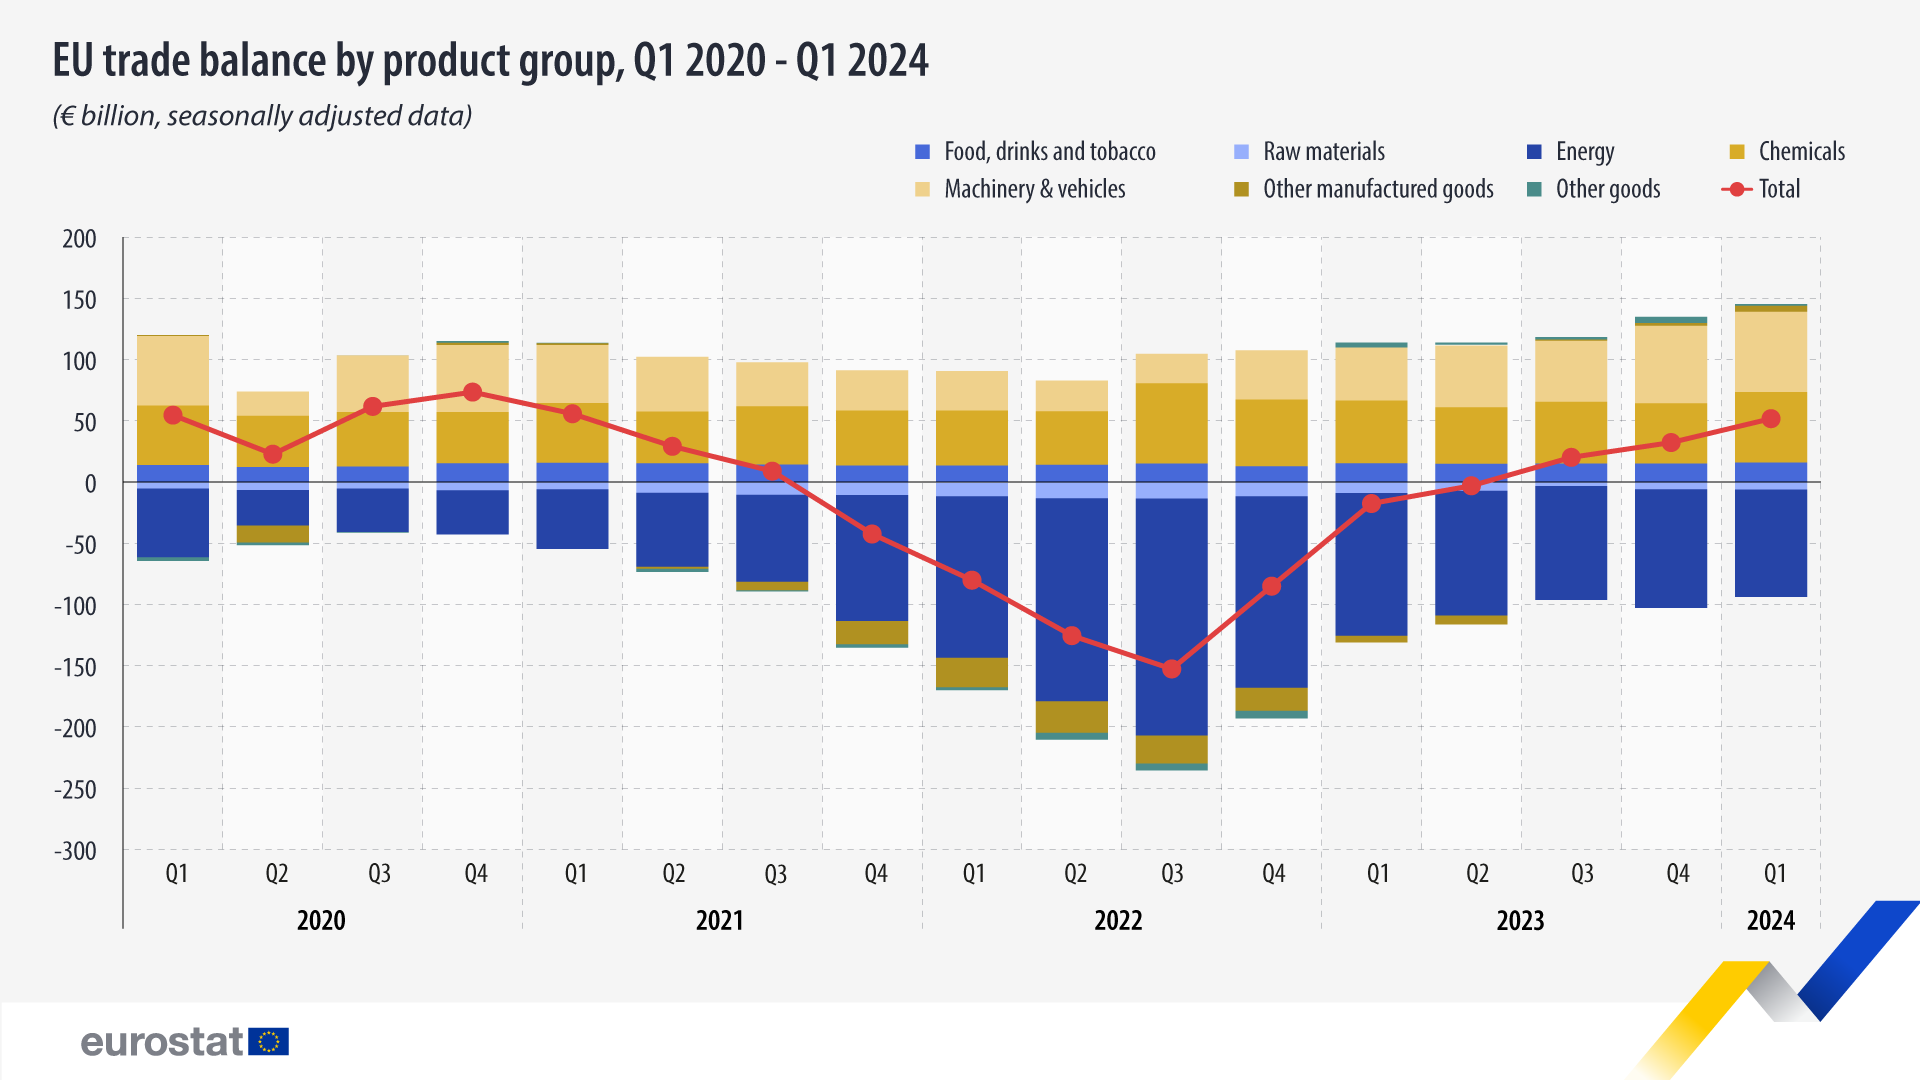
The EU balance for trade in goods rose from €31.7 billion in the fourth quarter of 2023 to €51.2 billion in the first quarter of 2024. The trade balance has shown a surplus for 3 quarters in a row, following a period of deficit from the fourth quarter of 2021 to the second quarter of 2023, primarily due to a high deficit for energy offsetting surpluses in other product categories.

Source dataset: ext_st_eu27_2020sitc
In the first quarter of 2024, the surpluses recorded in machinery and vehicles (€65.7 billion), chemicals (€57.6 billion), food and drink (€15.7 billion), other manufactured goods (€4.8 billion) and other goods (€1.3 billion) outweighed the deficits in energy (-€87.7 billion) and raw materials (-€6.3 billion).
For more information
- Statistics Explained article on extra-EU trade in goods - latest developments
- Thematic section on international trade of goods
- Database on international trade of goods
If you have any queries, please visit our contact us page.
