Highest ever EU trade deficit recorded in 2022

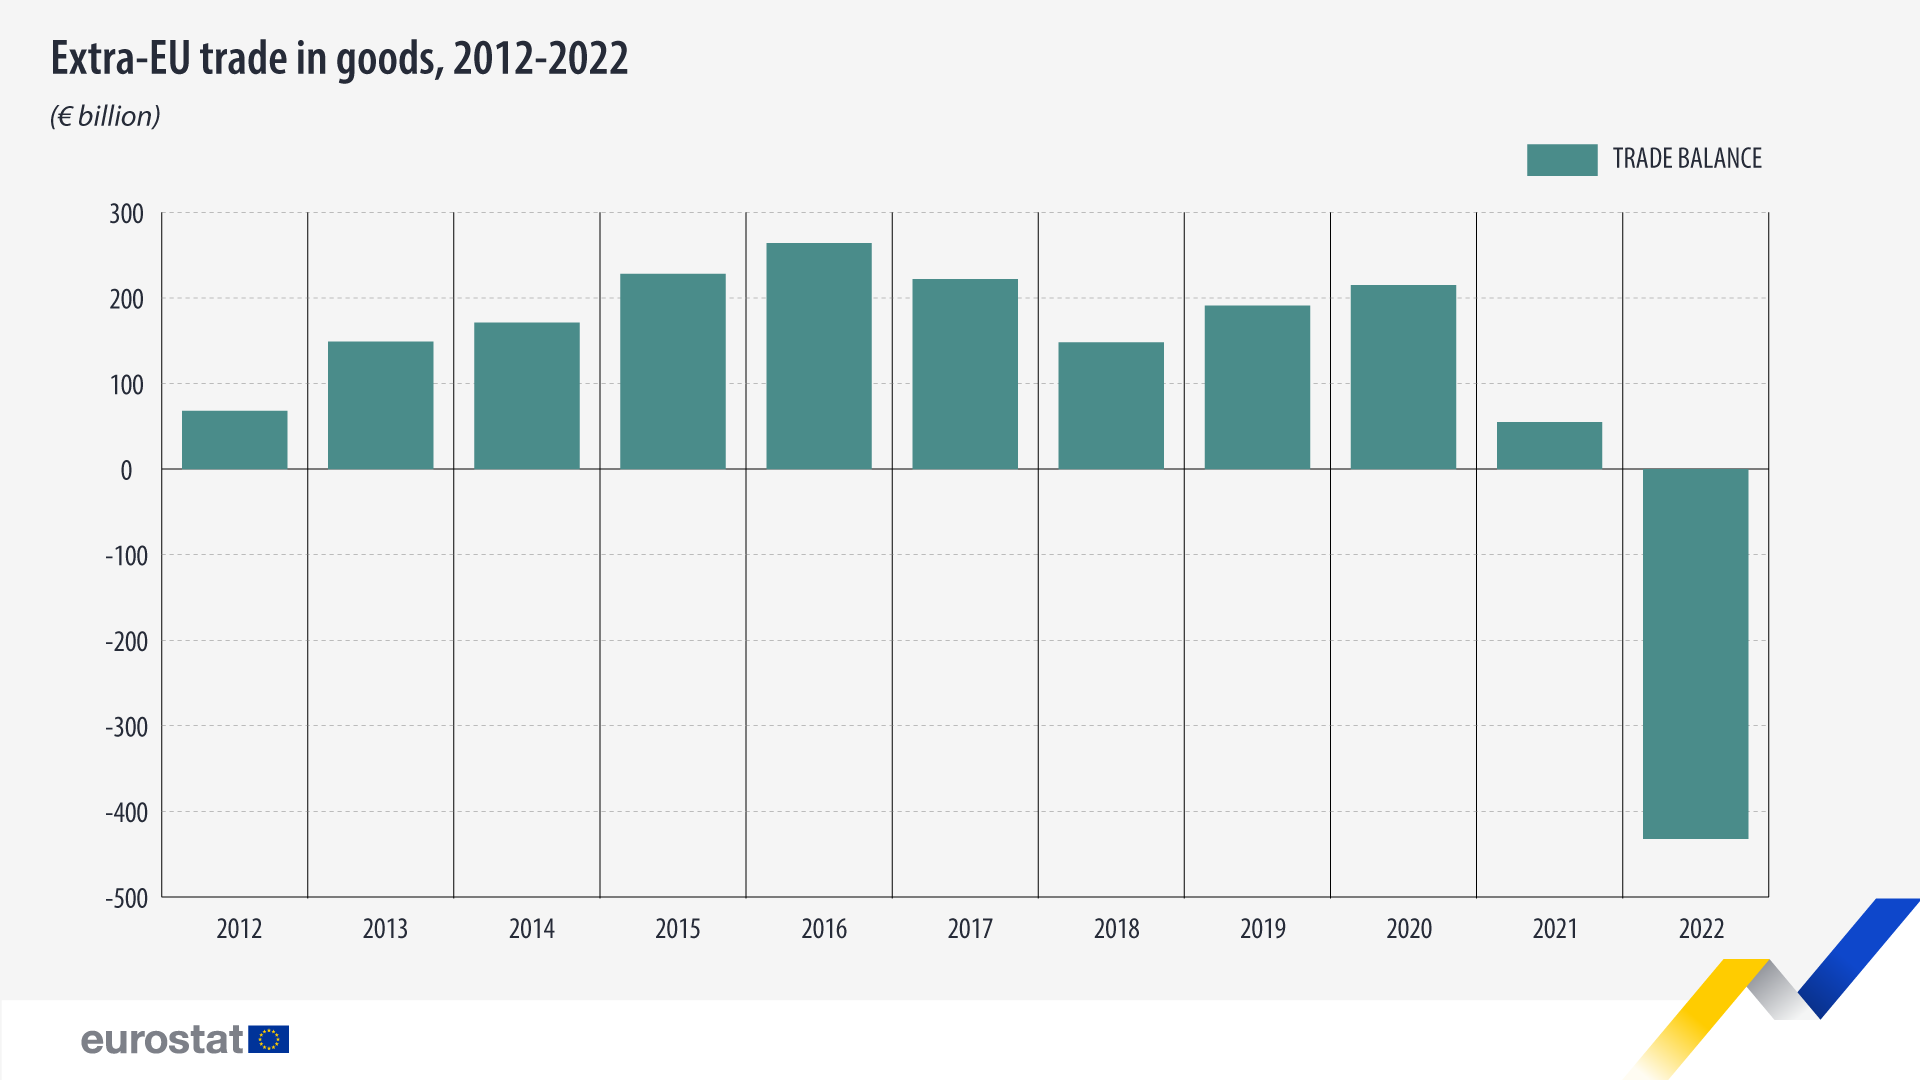
In 2022, the EU trade in goods balance registered a large deficit of €432 billion, reaching its lowest level since the start of the time series in 2002. The deficit was due, in particular, to a steep rise in the value of energy imports, which started towards the end of 2021 and continued through most of 2022.
This information comes from data on international trade in goods published recently by Eurostat. This article presents only a handful of findings from the more detailed Statistics Explained article.
Source dataset: ext_lt_intertrd
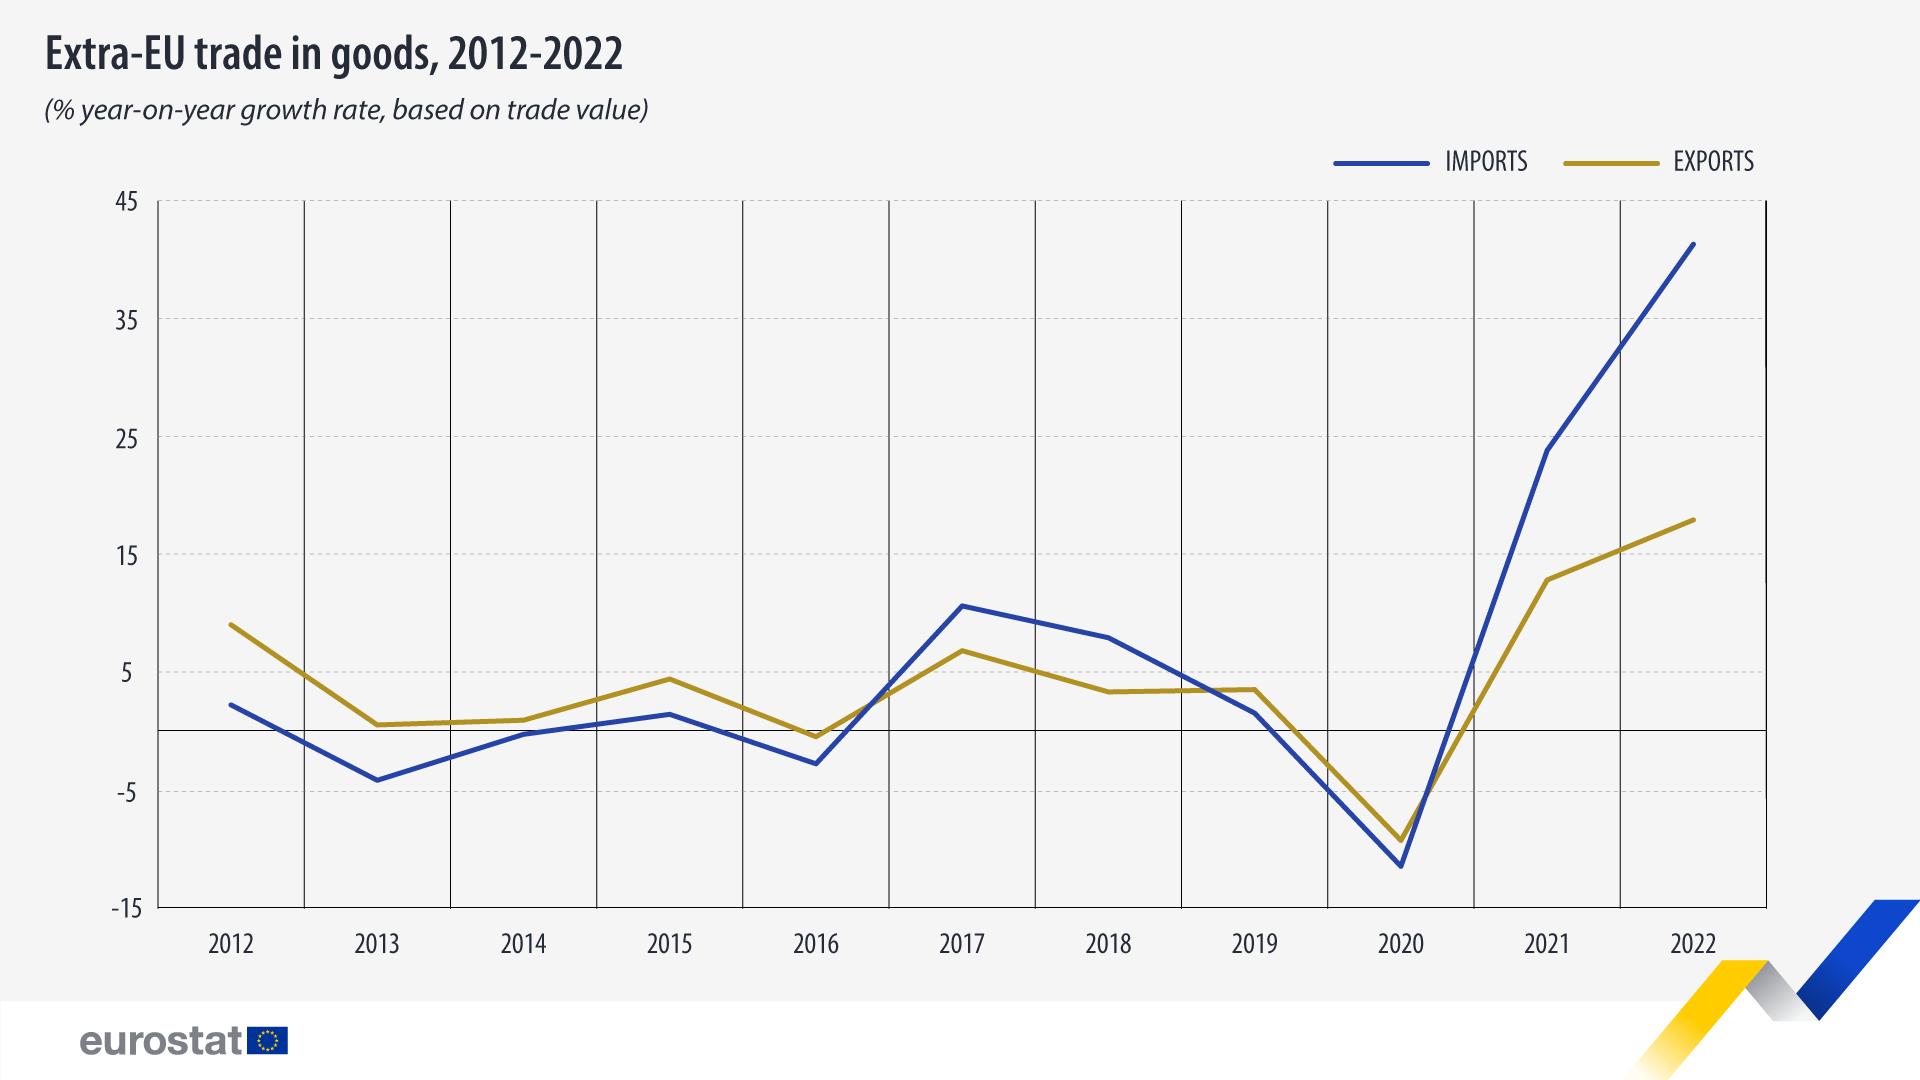
Also in 2022, driven by increasing prices, extra-EU imports (+41%) and exports (+18%) reached their highest year-on-year growth rates recorded over the last ten years.
Source dataset: ext_lt_intertrd
EU members reliant on the European single market
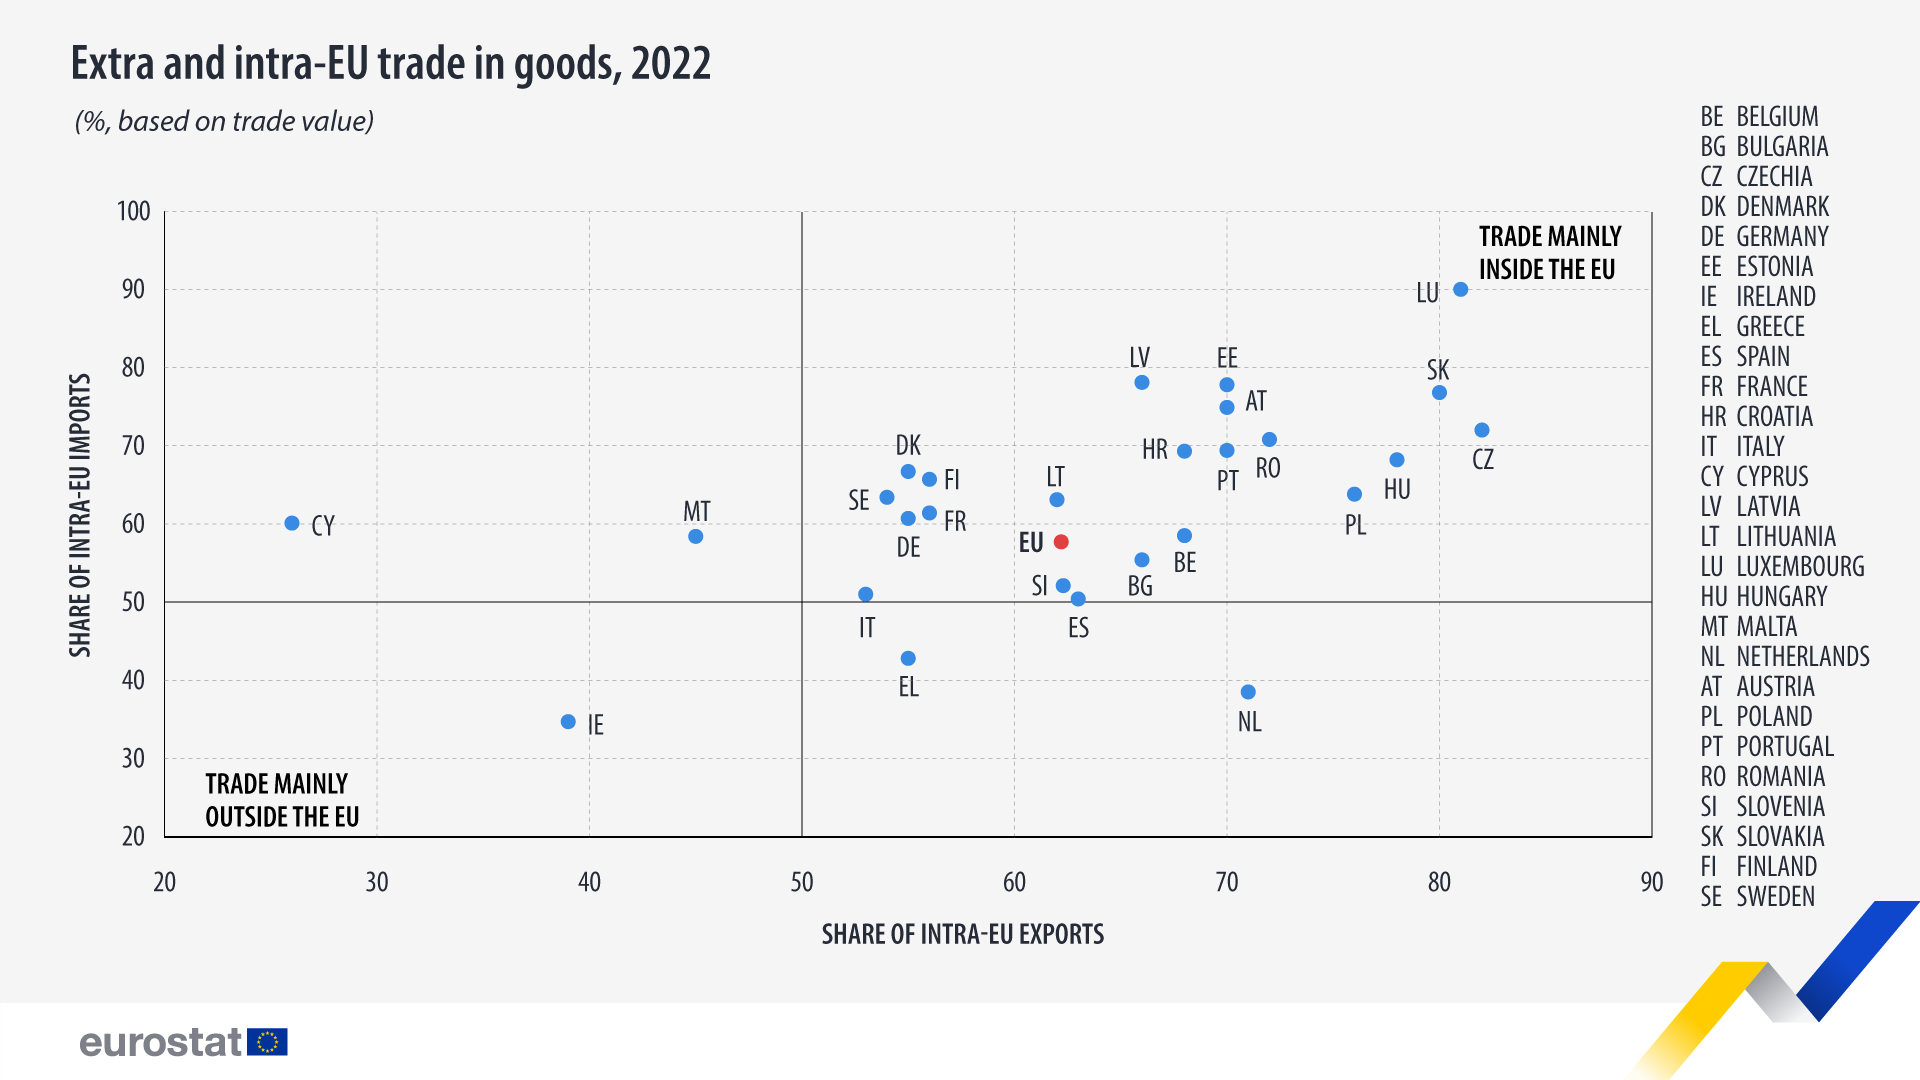
Data show that the EU’s internal market takes centre stage in EU countries’ trade of goods, although the proportion of intra-EU and extra-EU flows in total trade in goods varied considerably, reflecting, to some degree, historical ties and geographical location.
Source dataset: ext_lt_intratrd
Among the EU members, the highest share of intra-EU imports was recorded in Luxembourg (90% of its total imports), while the highest share for intra-EU exports was recorded in Czechia (82% of its total exports).
On the other hand, the lowest share of intra-EU imports was recorded in Ireland (35% of its total imports), which is mainly because its primary trade partner is the United Kingdom. Additionally, the lowest share of intra-EU exports was reported in Cyprus (26% of its total exports).
In 2022, the Netherlands imported a large share of goods from extra-EU countries (only 39% of its imports were intra-EU) and exported them within the EU (71% of its exports were intra-EU).
For more information
- Statistics Explained article on international trade in goods
- Thematic section on international trade in goods
- Database on international trade in goods
- Statistics 4 Beginners on trade in goods
If you have any queries, please visit our contact us page.


