How much do households spend on food and alcohol?

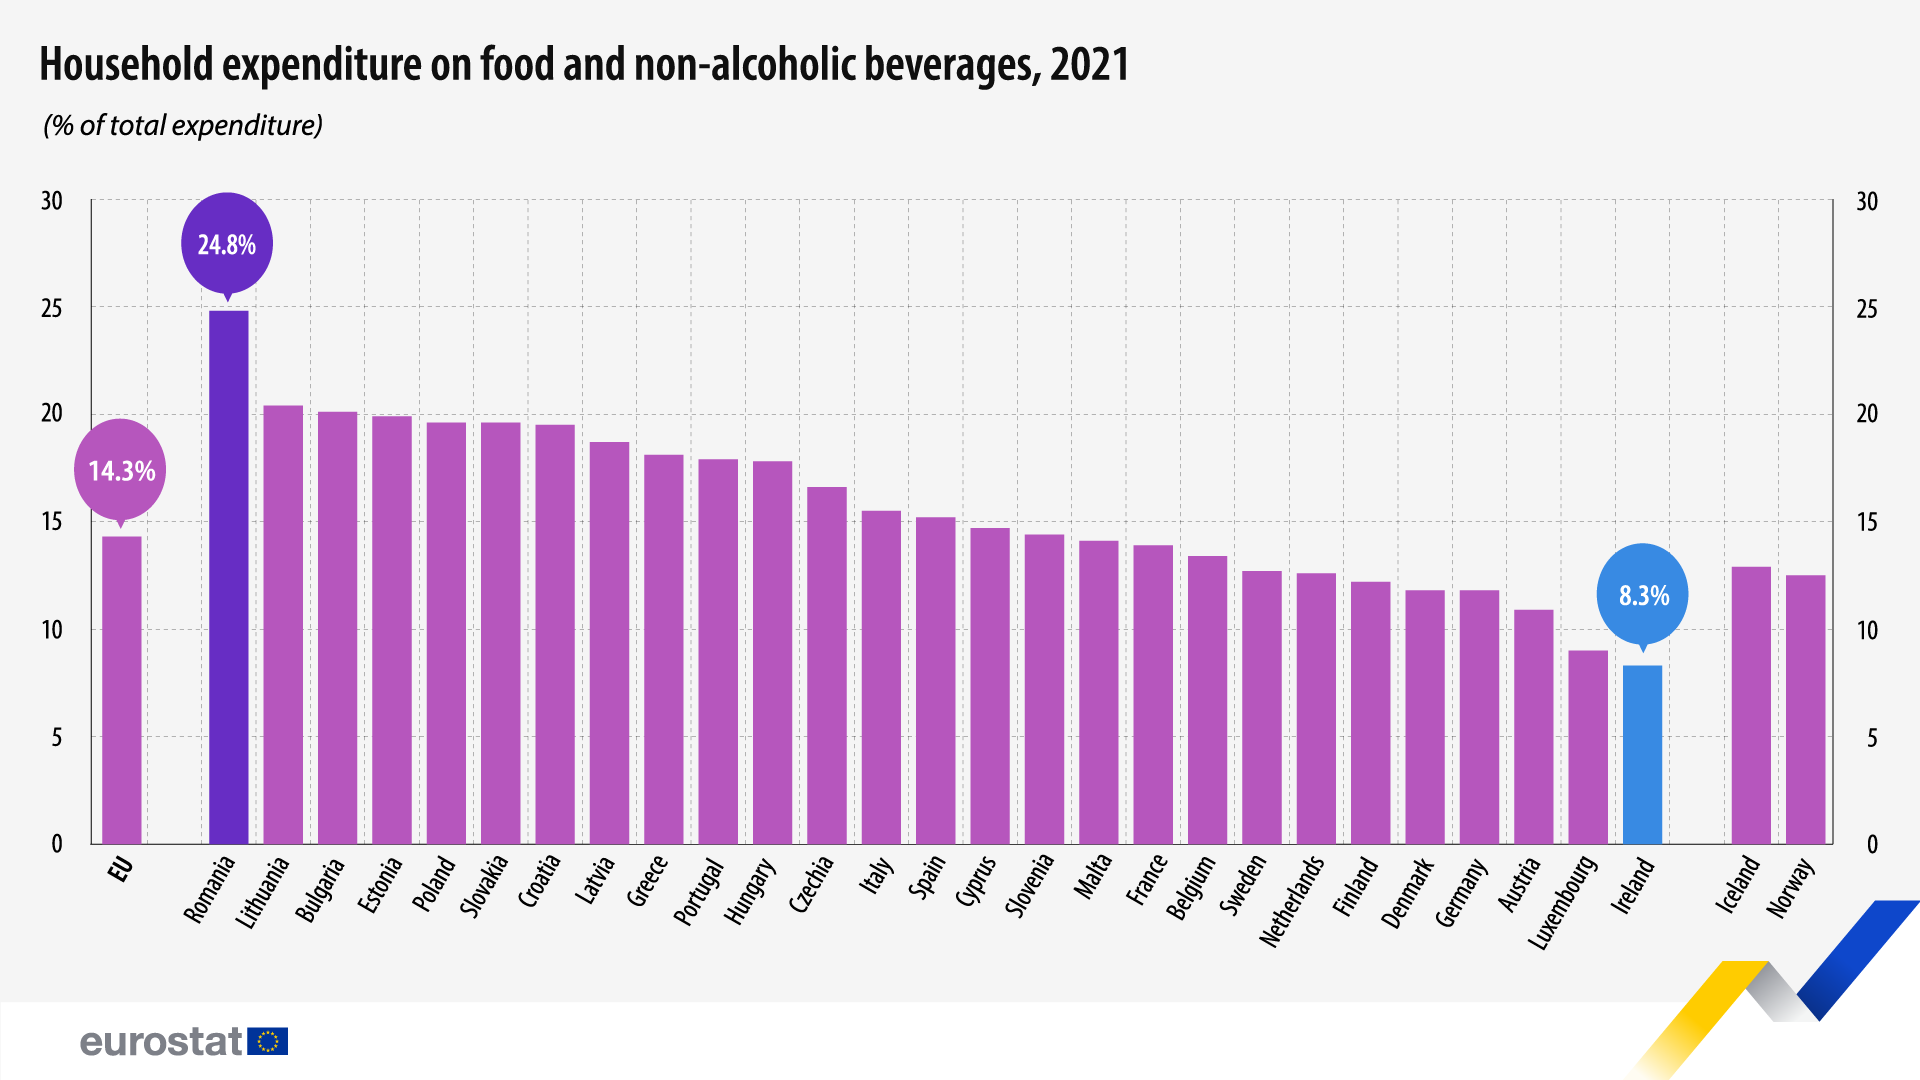
In 2021, households in the EU spent over €1 035bn (equivalent to 7.1% of the total EU GDP) on 'Food and non-alcoholic beverages'. This represents a share of 14.3% of total household expenditure. Compared with 2020 (14.8% share), this represents a decrease of 0.5 percentage points (pp).
The highest shares for 'Food and non-alcoholic beverages’ expenditure in 2021 were registered in Romania (24.8%), Lithuania (20.4%), Bulgaria (20.1%), Estonia (19.9%), Poland and Slovakia (both 19.6%).
Source dataset: nama_10_co3_p3
In contrast, the lowest shares were in Ireland (8.3%), Luxembourg (9.0%), Austria (10.9%), Denmark and Germany (both 11.8%).
Compared with 2020, the share of total household expenditure on food decreased in all EU countries, except for Poland and Slovakia, where it increased (both +0.2 pp). The highest decreases were in Greece (-1.7 pp), Lithuania (-1.4 pp) and Croatia, Estonia and Slovenia (all -1.3 pp)
Almost 1% of the EU GDP is spent on alcoholic beverages
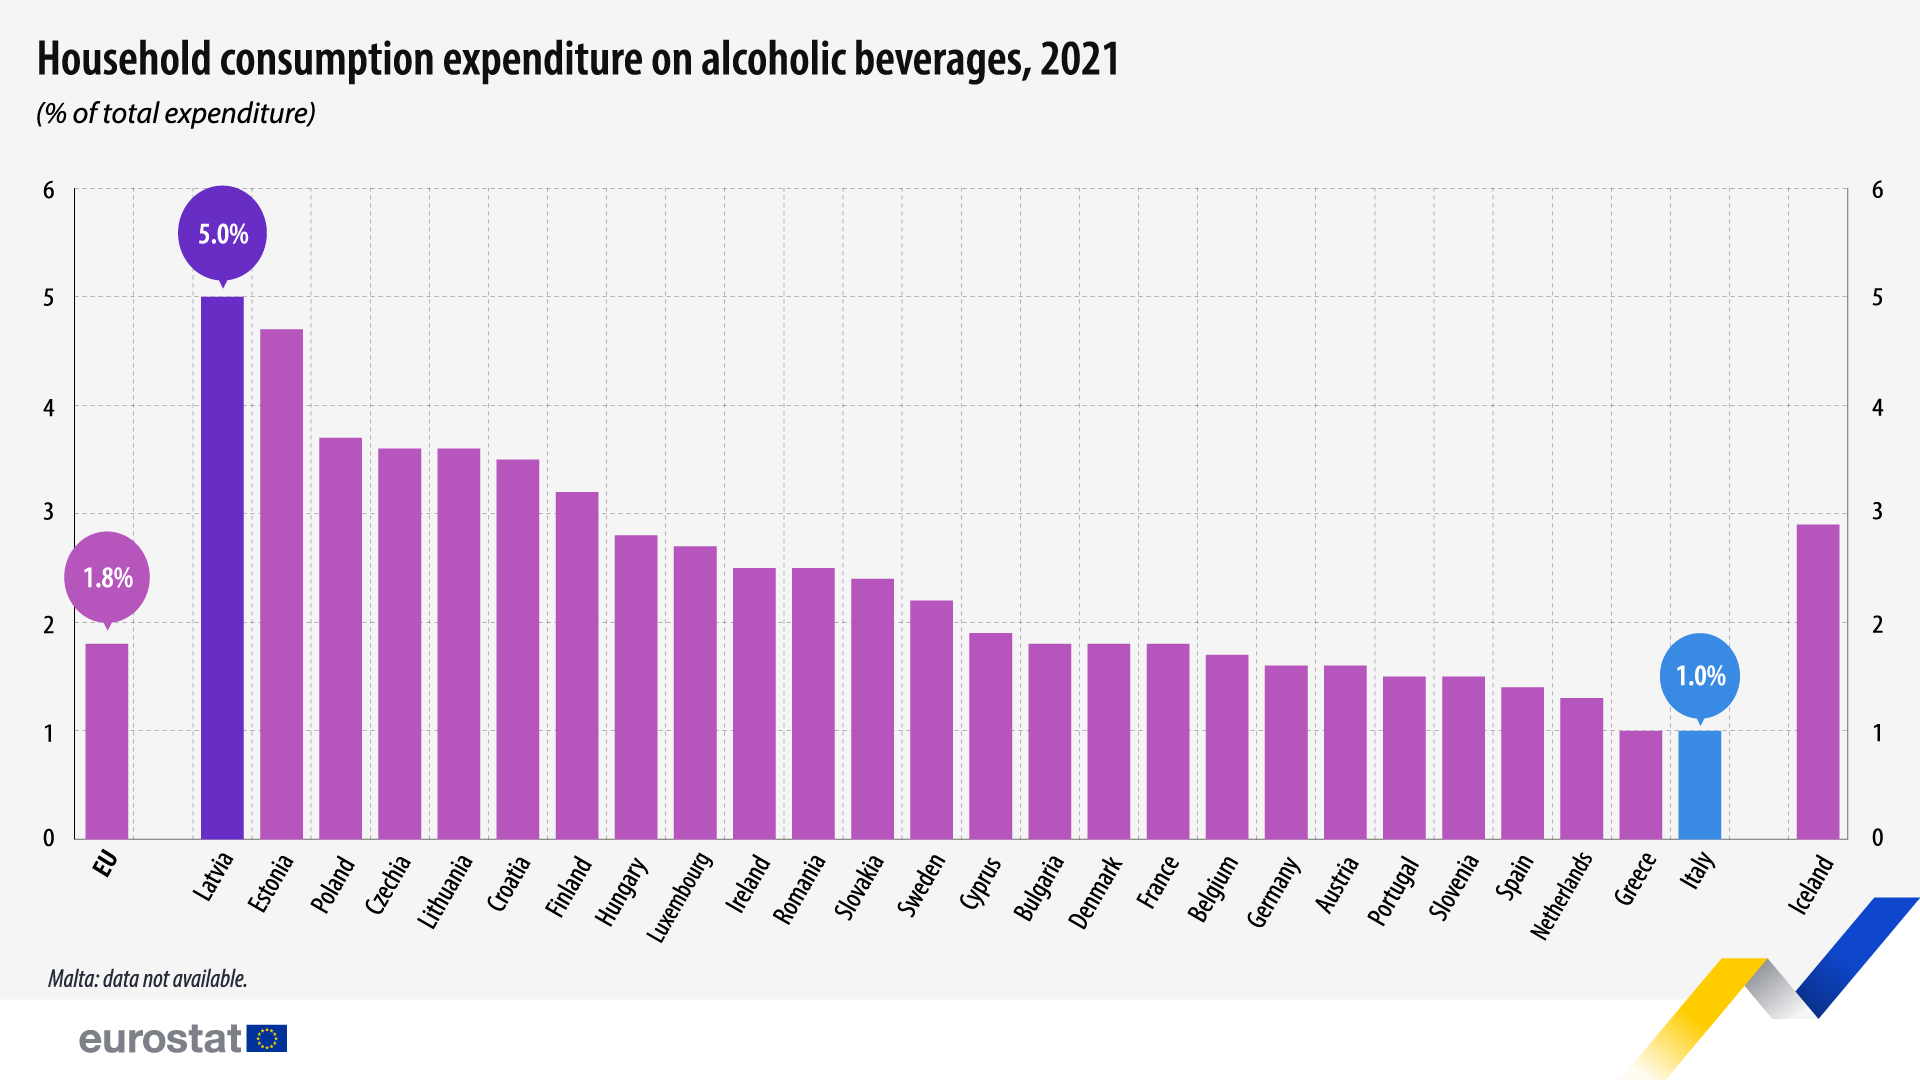
In 2021, households in the EU spent €128 billion (equivalent to 0.9% of the EU GDP) on ‘alcoholic beverages’. This represents 1.8% of their total consumption expenditure, the same percentage share as in 2020.
Among EU members, the highest shares of total consumption expenditure on alcoholic beverages in 2021 were registered in Latvia (5.0%), Estonia (4.7%), Poland (3.7%), Lithuania and Czechia (both 3.6%). On the contrary, the lowest shares were in Greece and Italy (both 1.0%), the Netherlands (1.3%) and Spain (1.4%).
Source dataset: nama_10_co3_p3
In 2021, compared with the previous year, the share of total household expenditure on alcohol remained unchanged in 10 EU countries (Belgium, Denmark, Germany, Greece Luxembourg, the Netherlands, Austria, Poland, Romania, Slovakia) and it increased only in Croatia (+0.6 pp). Among the remaining EU members, the largest decreases were recorded in Ireland (-0.5 pp), Latvia and Lithuania (both -0.4 pp), Spain and Estonia (both -0.3 pp).
Would you like to know more about household consumption expenditure?
A more complete overview, broken down by consumption purpose, is available in the Statistics Explained article and the visualization tool on household expenditure.
For more information
- Statistics Explained article on household consumption by purpose
- Thematic Statistics Explained section on national accounts
- Thematic section on national accounts
- Database on national accounts
- Visualisation tool on household expenditure
Methodological notes:
- Expenditure on alcoholic beverages: does not include expenditure on alcoholic beverages in restaurants and hotels.
If you have any queries, please visit our contact us page.


