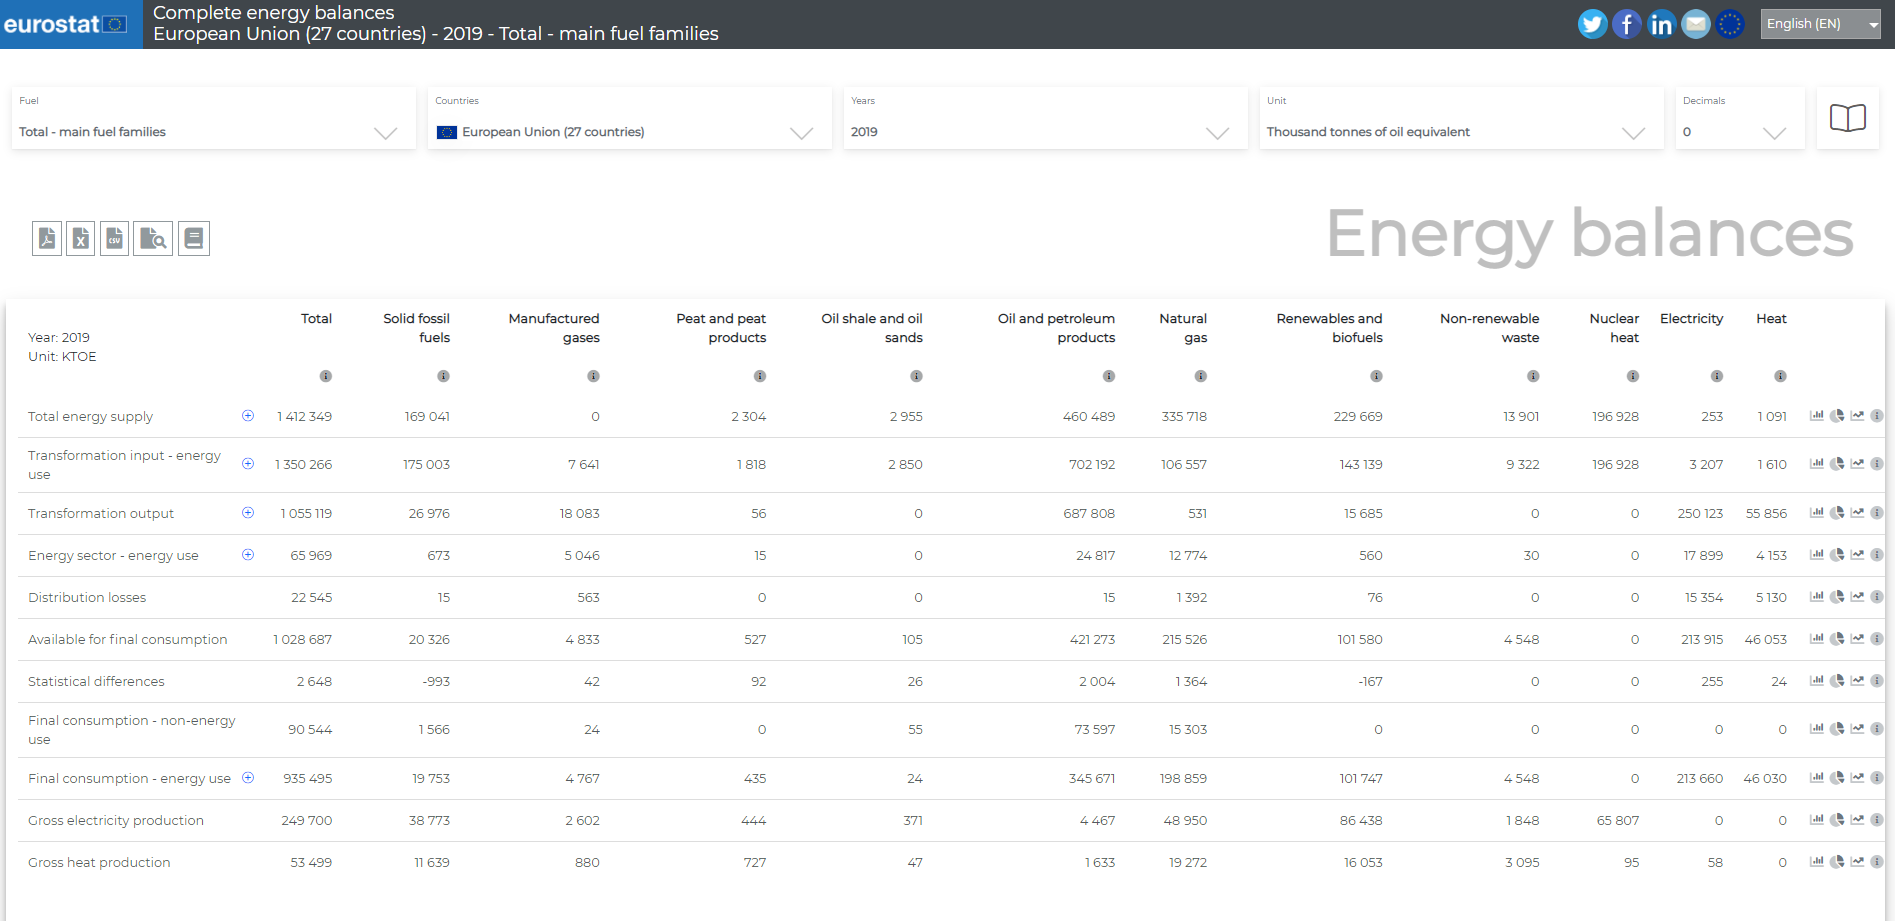
Would you like to have a quick and interactive overview of energy balances in Europe or your country? Do you want to know from which fuels electricity is produced in your country? Or would you like to compare your country’s energy market with other countries?
For any of the above, our new interactive tool will allow you to easily visualise energy balances, see how much energy is imported or produced in the European Union or in your country, find out where the energy is consumed and check out the principal renewable energy sources. Customise your table and charts by choosing the fuel, country, year, unit and compare your country with others using bar charts.
You can also save your visualisation and share it through your favourite social media channels. The Energy balances visualisation tool is available in English, French and German. Discover these and many more features by clicking on the image below:
For further information:
- Overview of energy statistics.
- Statistics Explained articles on energy statistics.
To contact us, please visit our User Support page.
For press queries, please contact our Media Support.

