
We are happy to announce that the beta version of the new Eurostat data browser is now available online. We would like you to try it out and give us your feedback. This new tool contains improved functionalities that allow users to customise, visualise and extract statistical data in an easy and interactive way.
Once this testing phase - which runs until end of September - is concluded, the data browser will replace the “Tables, Graphs and Maps (TGM) Tool” later this year.
Where can I find it?
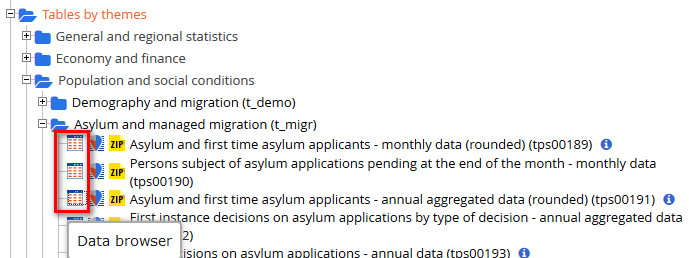
The new data browser is offered in parallel with the interface Tables, Graphs and Maps for “tables by themes” and “tables by EU policy” in the Eurostat navigation tree. Click on this icon  to have access to the tool:
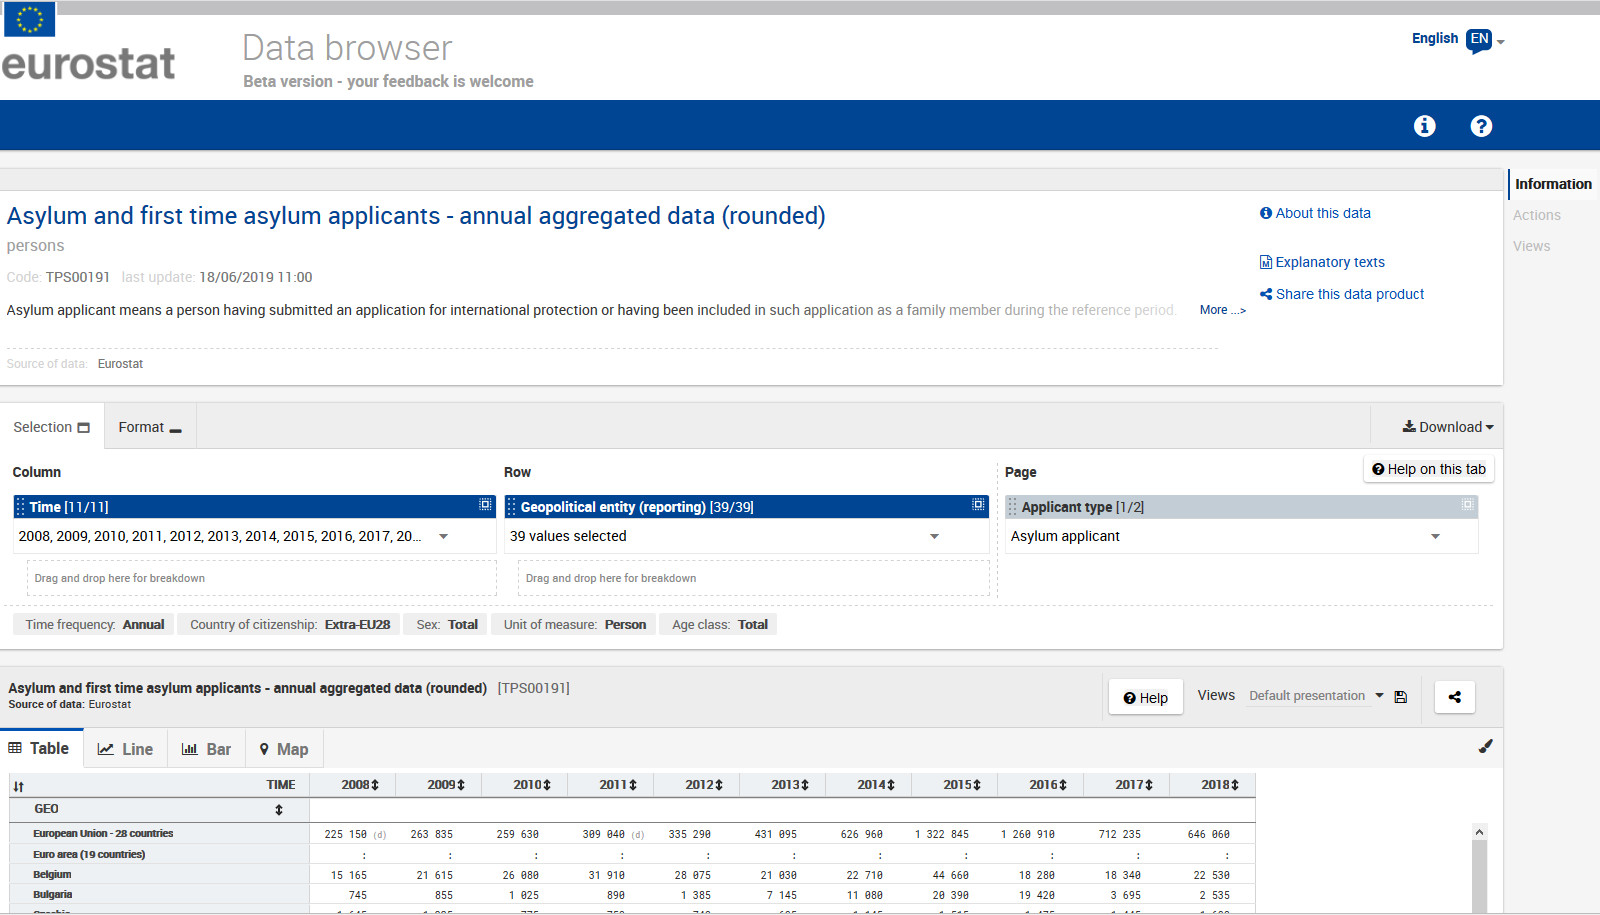
What are the main functionalities?
The Data Browser basically replaces the existing functionality of the “Tables, Graphs and Maps (TGM) Tool” and adds additional functionality when consulting data and metadata: filtering on data dimensions, graphic data display (line, bar and map charts) which makes it easy to compare indicators and geographical areas.
Some highlighted features:
- Users can easily customise data visualisations and save their favourite views for later use.
- Increased number of download options as Excel, SDMX 2.0 and 2.1, TSV and Json-Stat.
- Increased sharing possibilities through bookmarks and social media.
- Responsiveness and support of the majority of Internet browsers, including Android and Ipad tablets.
- Contextual help system to assist the user when needed.
Give us your feedback via our user support page.
Thanks for helping us to improve our products!